The WebFora client dashboard: what is where
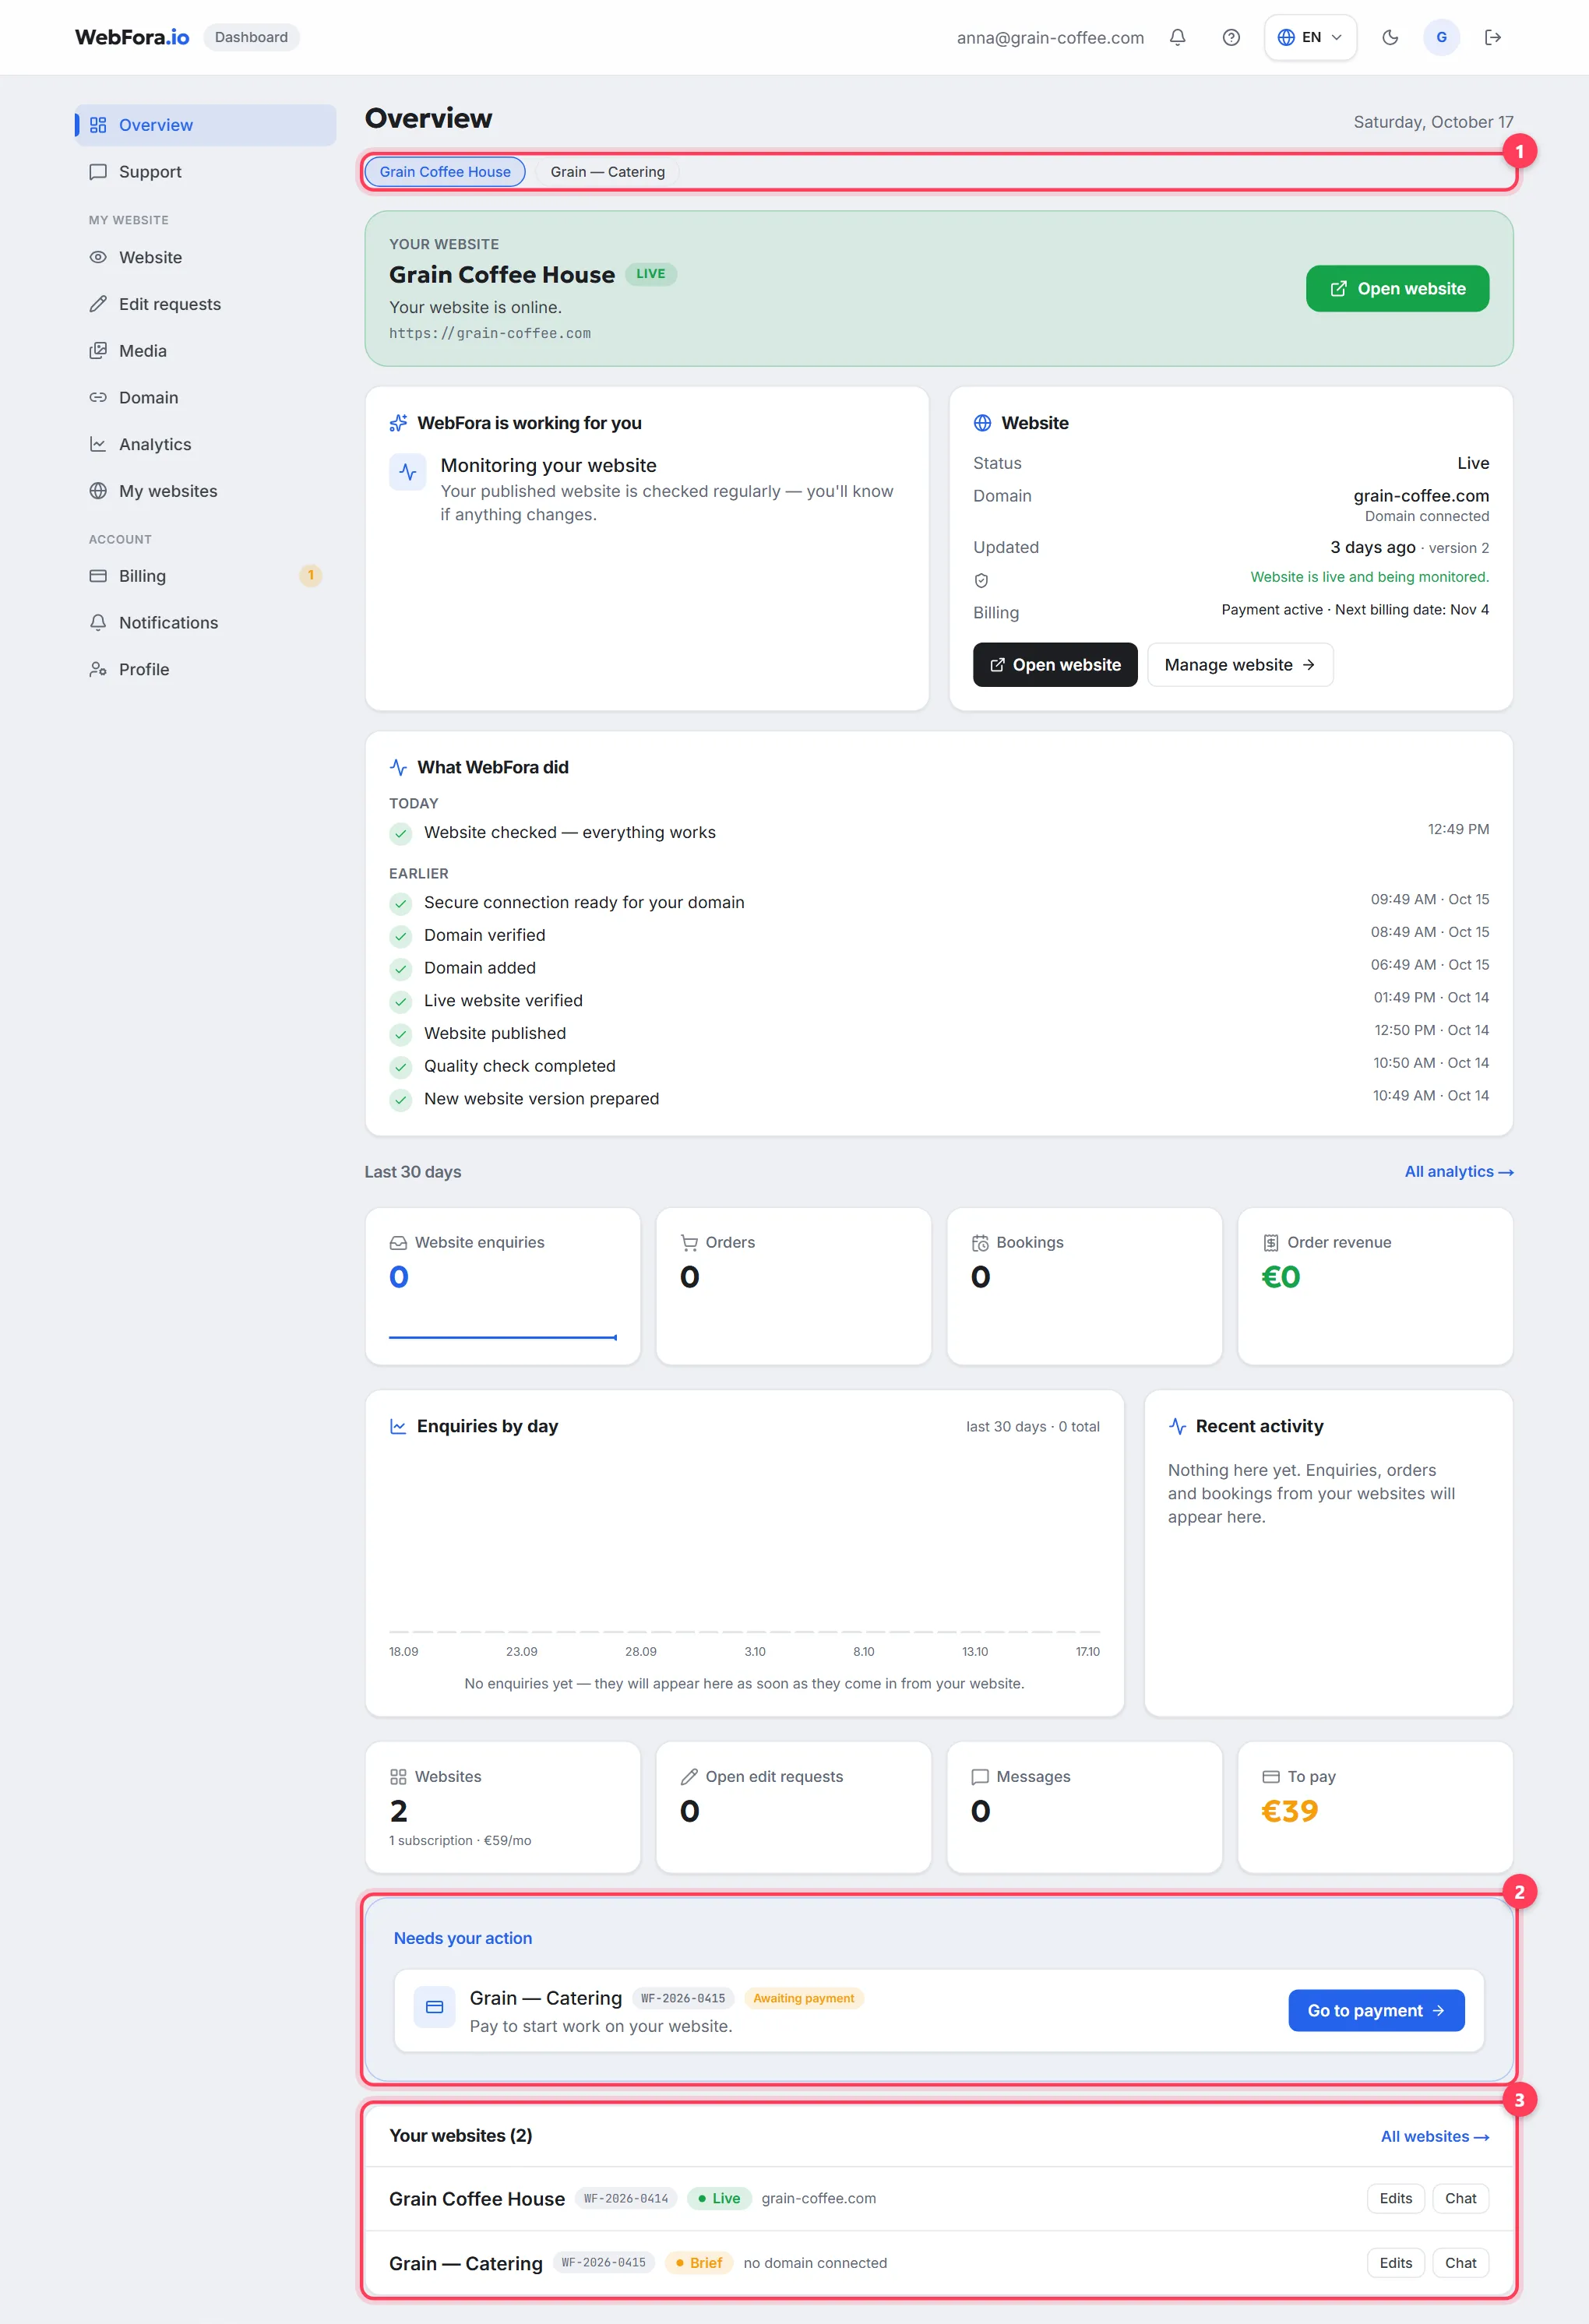
Your WebFora client dashboard opens on “Overview”: at the top, your website's status and the next step; below, what the team is doing and has already done, plus enquiries from your website over the last 30 days. The menu on the left has two groups — “My website” (website, edits, media, domain, analytics) and “Account” (billing, notifications, profile). Questions for your manager go to “Support”.
Dashboard menu: what each section is for
How to use the client dashboard in short: the menu on the left (a row of tabs at the top on a phone) is the same on every page of your website client dashboard. Two items sit at the top without a group, then two groups: “My website” and “Account”.
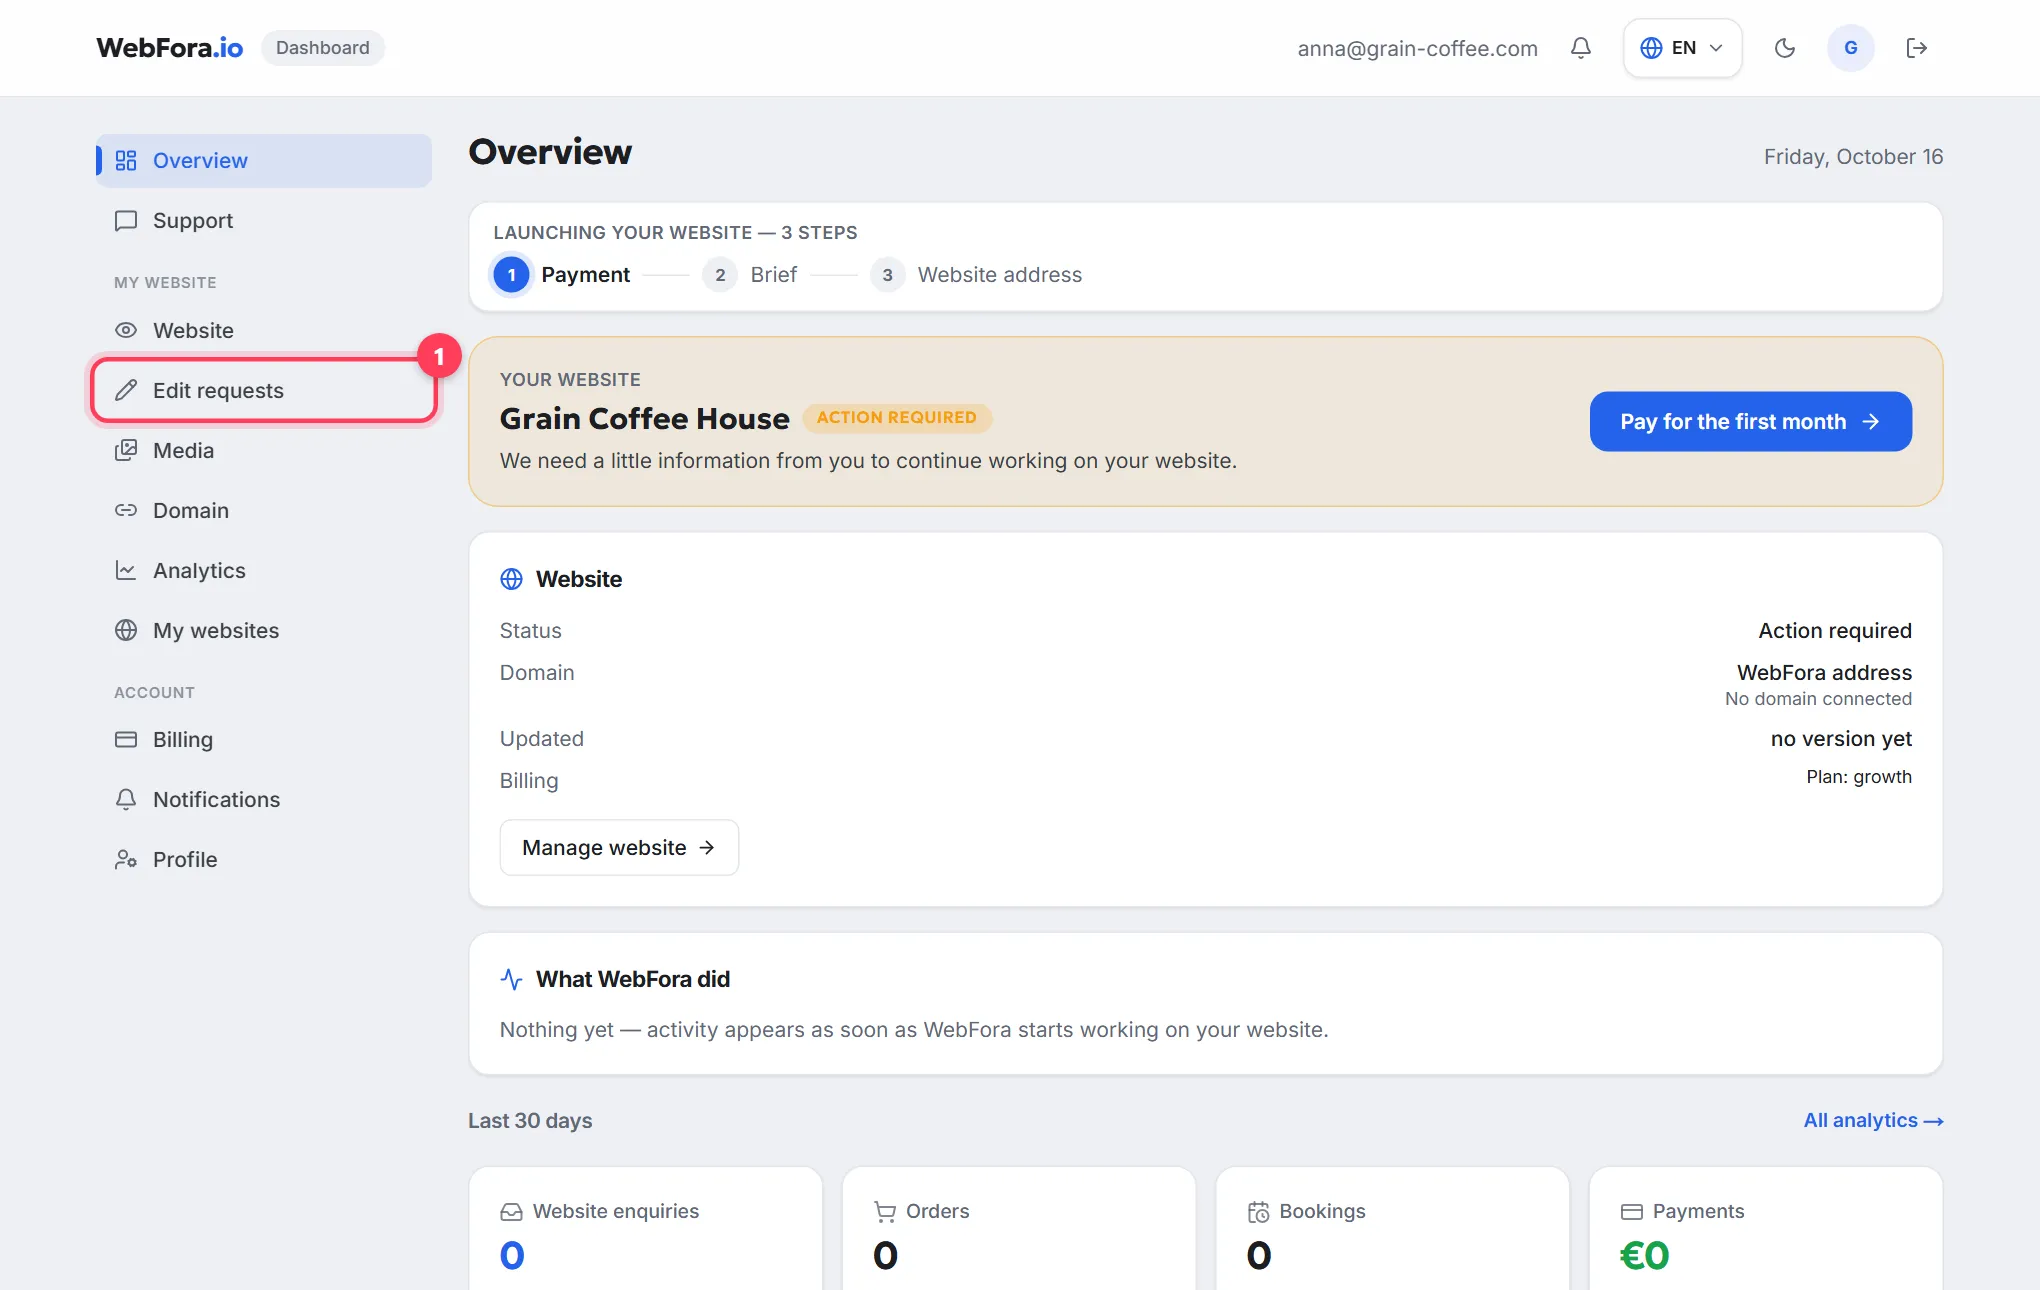
| Menu item | What it's for |
|---|---|
| Overview | Home page: website status, next step, what the team did, enquiries over 30 days |
| Support | Chat with your manager about your website; the unread counter lives here too |
| Website | The current version of your website: review it, ask for changes, approve, version history |
| Edit requests | Small targeted edits (text, photo, price, phone) and custom tasks with a quote |
| Media | Picture library: logo, photos for the first screen, gallery and the About section |
| Domain | Connecting your own website address (domain) to the finished website |
| Analytics | Enquiries by day, handling funnel, contact channels, monthly report |
| My websites | All your websites and subscriptions; each has modules, “Website tools” and auto-renewal |
| Billing | Invoices, wallet balance, subscriptions by service, documents and statements |
| Notifications | Where website enquiries are delivered: Telegram, email, WhatsApp |
| Profile | Name, business, phone, password change, email notifications |
Each section has its own step-by-step guide: filling in the brief, reviewing and approving a version, requesting edits, uploading photos and a logo, connecting your domain, invoices and payments, enquiry alerts and website analytics.
Where to see your website status: the “Your website” block
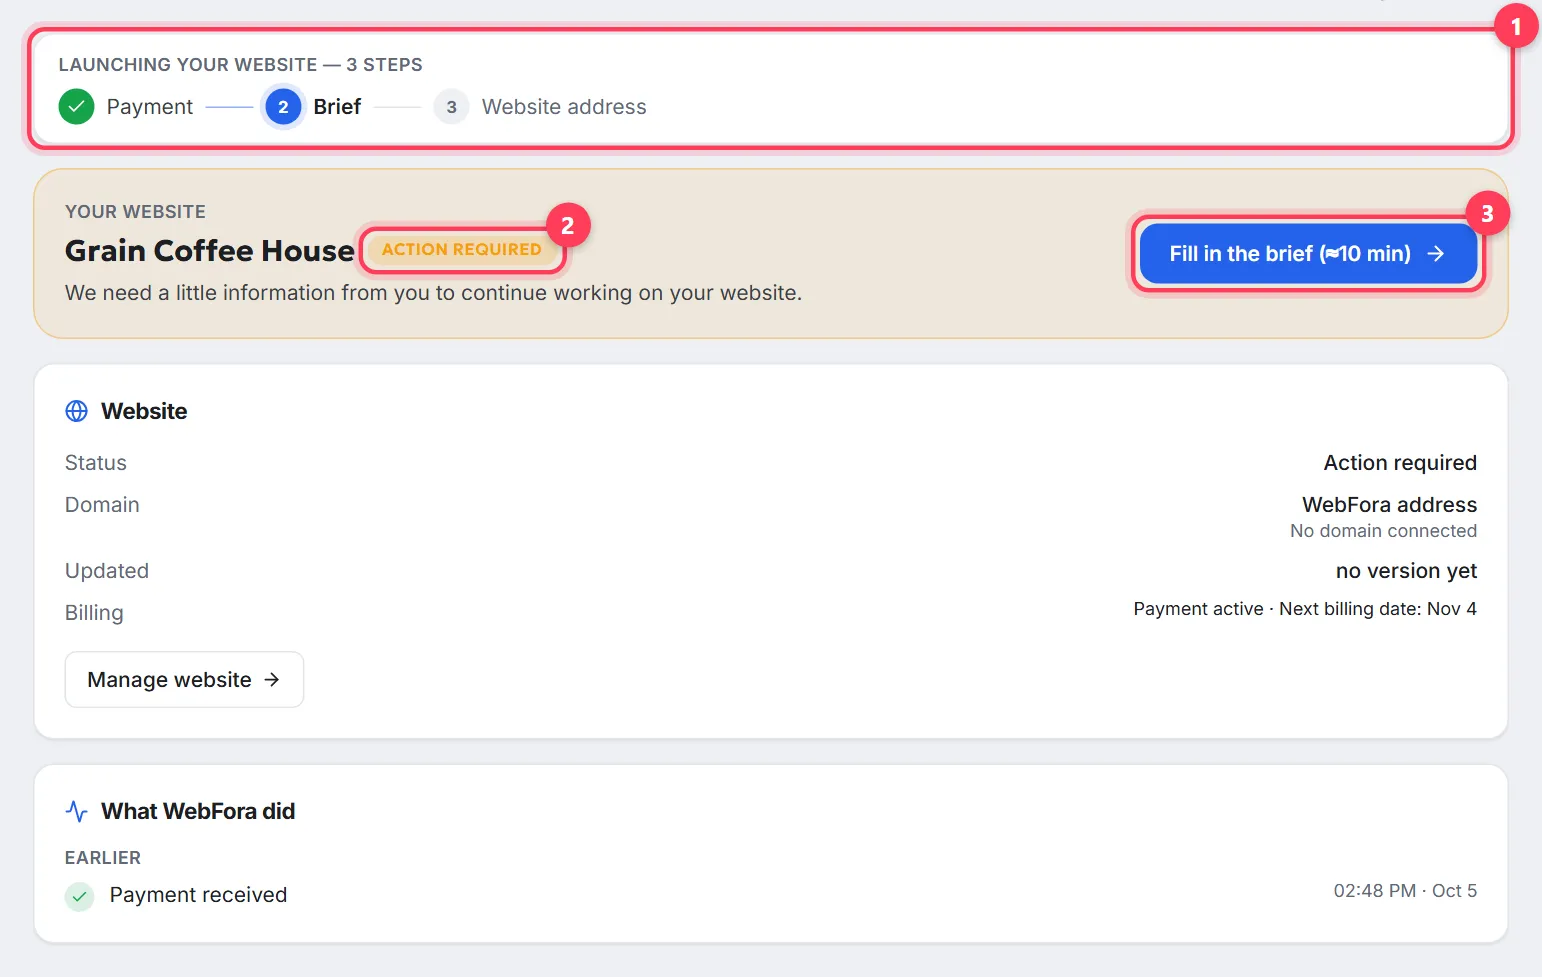
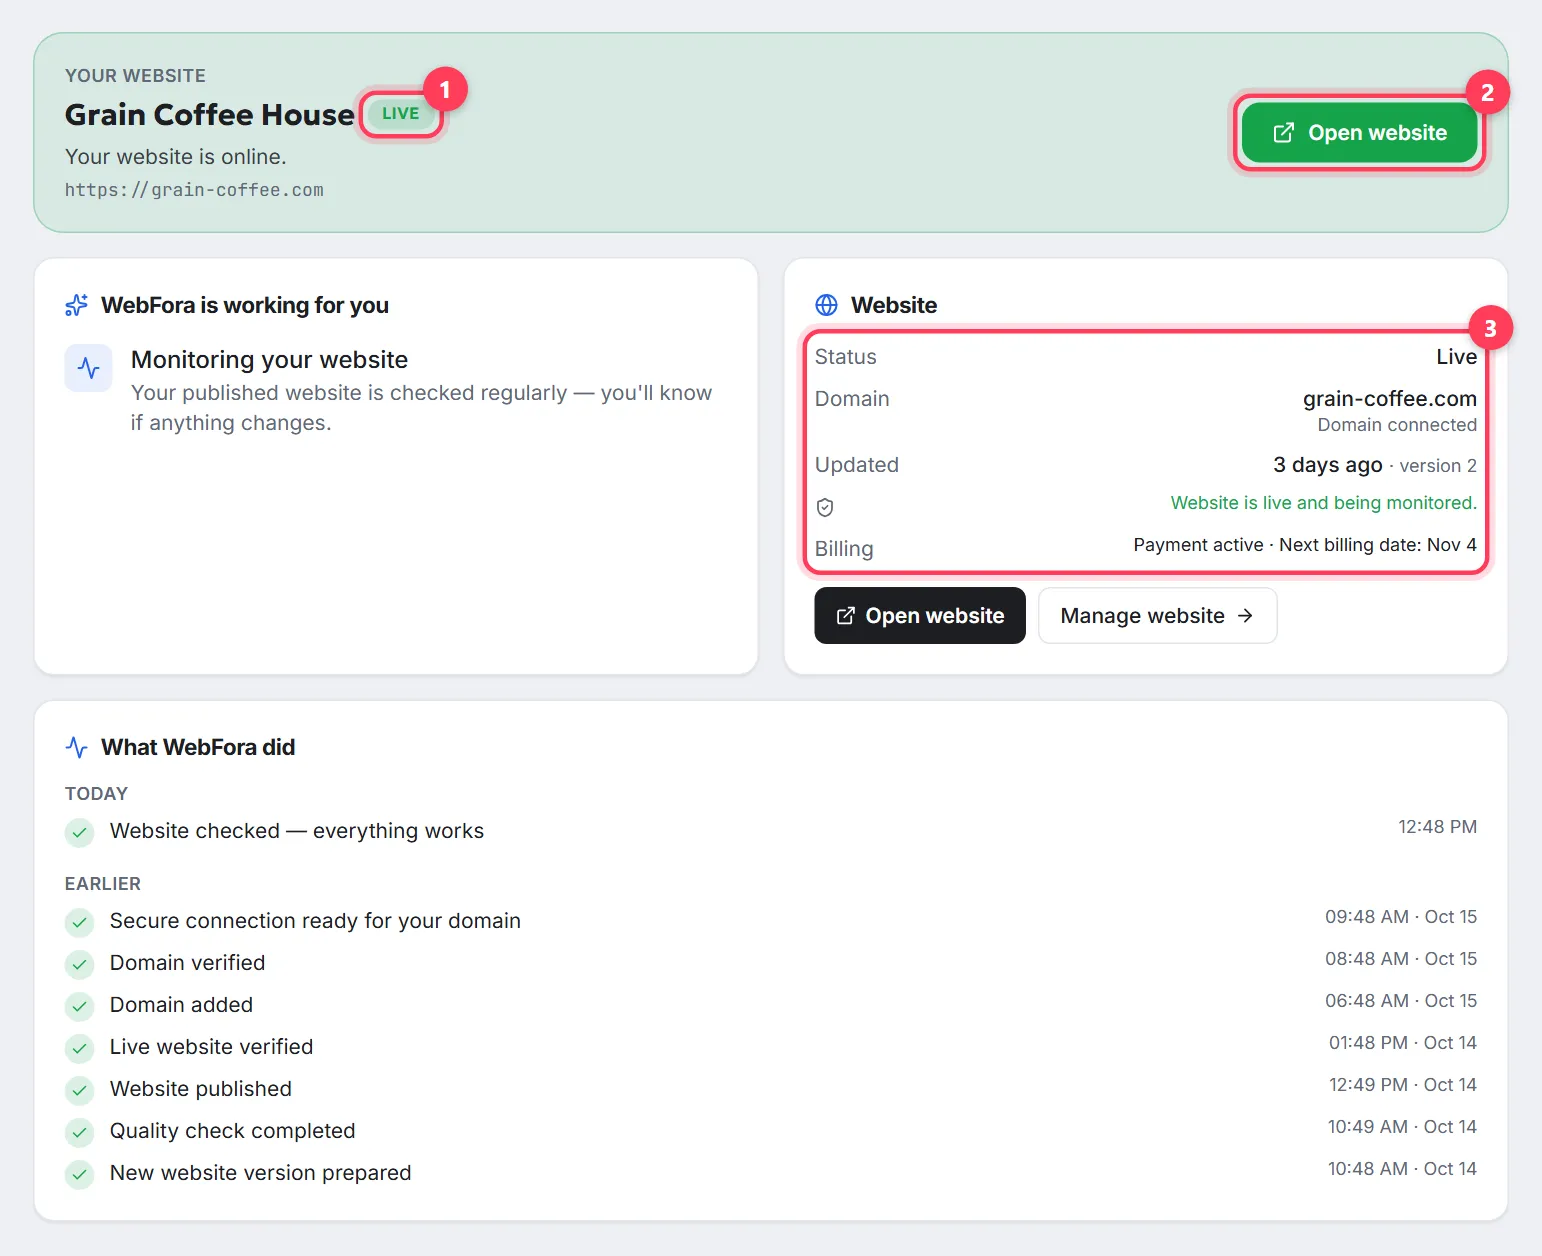
The first block on “Overview” is “Your website”. Next to the website name is a status label, under it one sentence about what is happening now, and one button — the next action. Until the website is launched, the block is preceded by “Launching your website — 3 steps”: Payment → Brief → Website address; completed steps get a tick.
| Label | What it means |
|---|---|
| Action required | The team is waiting for something from you: a payment, the brief, a chat reply or a decision on a version. The exact step is in the “Action required” list below |
| Preparing | Your brief is in and the team is preparing the first version. Promised dates are shown here: “First version of your site — by …” and “Launch — by …” |
| Checking | The new version is being checked automatically: pages, links, mobile layout, contact details |
| Ready for review | A version is ready — review it in “Website” and approve it or request a change |
| Updating | An improvement is being prepared; your current website keeps working |
| Approved | You approved a version and the team is publishing it — nothing to do on your side |
| Live | Your website is online; “Open website” takes you there |
| Reviewing | The team is fixing a technical issue before showing the next version |
Below it is the “Website” card with four lines: Status, Domain (“WebFora address” until your own domain is connected), Updated (date and version number) and Billing (for example “Payment active · Next billing date: …”). The “Open website” and “Manage website” buttons go to the live site and to the “Website” section.
“WebFora is working for you” and “What WebFora did”
The “WebFora is working for you” block appears when the team is doing something right now: creating your website, checking it, preparing an improvement, waiting for your approval, publishing, monitoring. It answers “what's happening?” without a call to your manager.
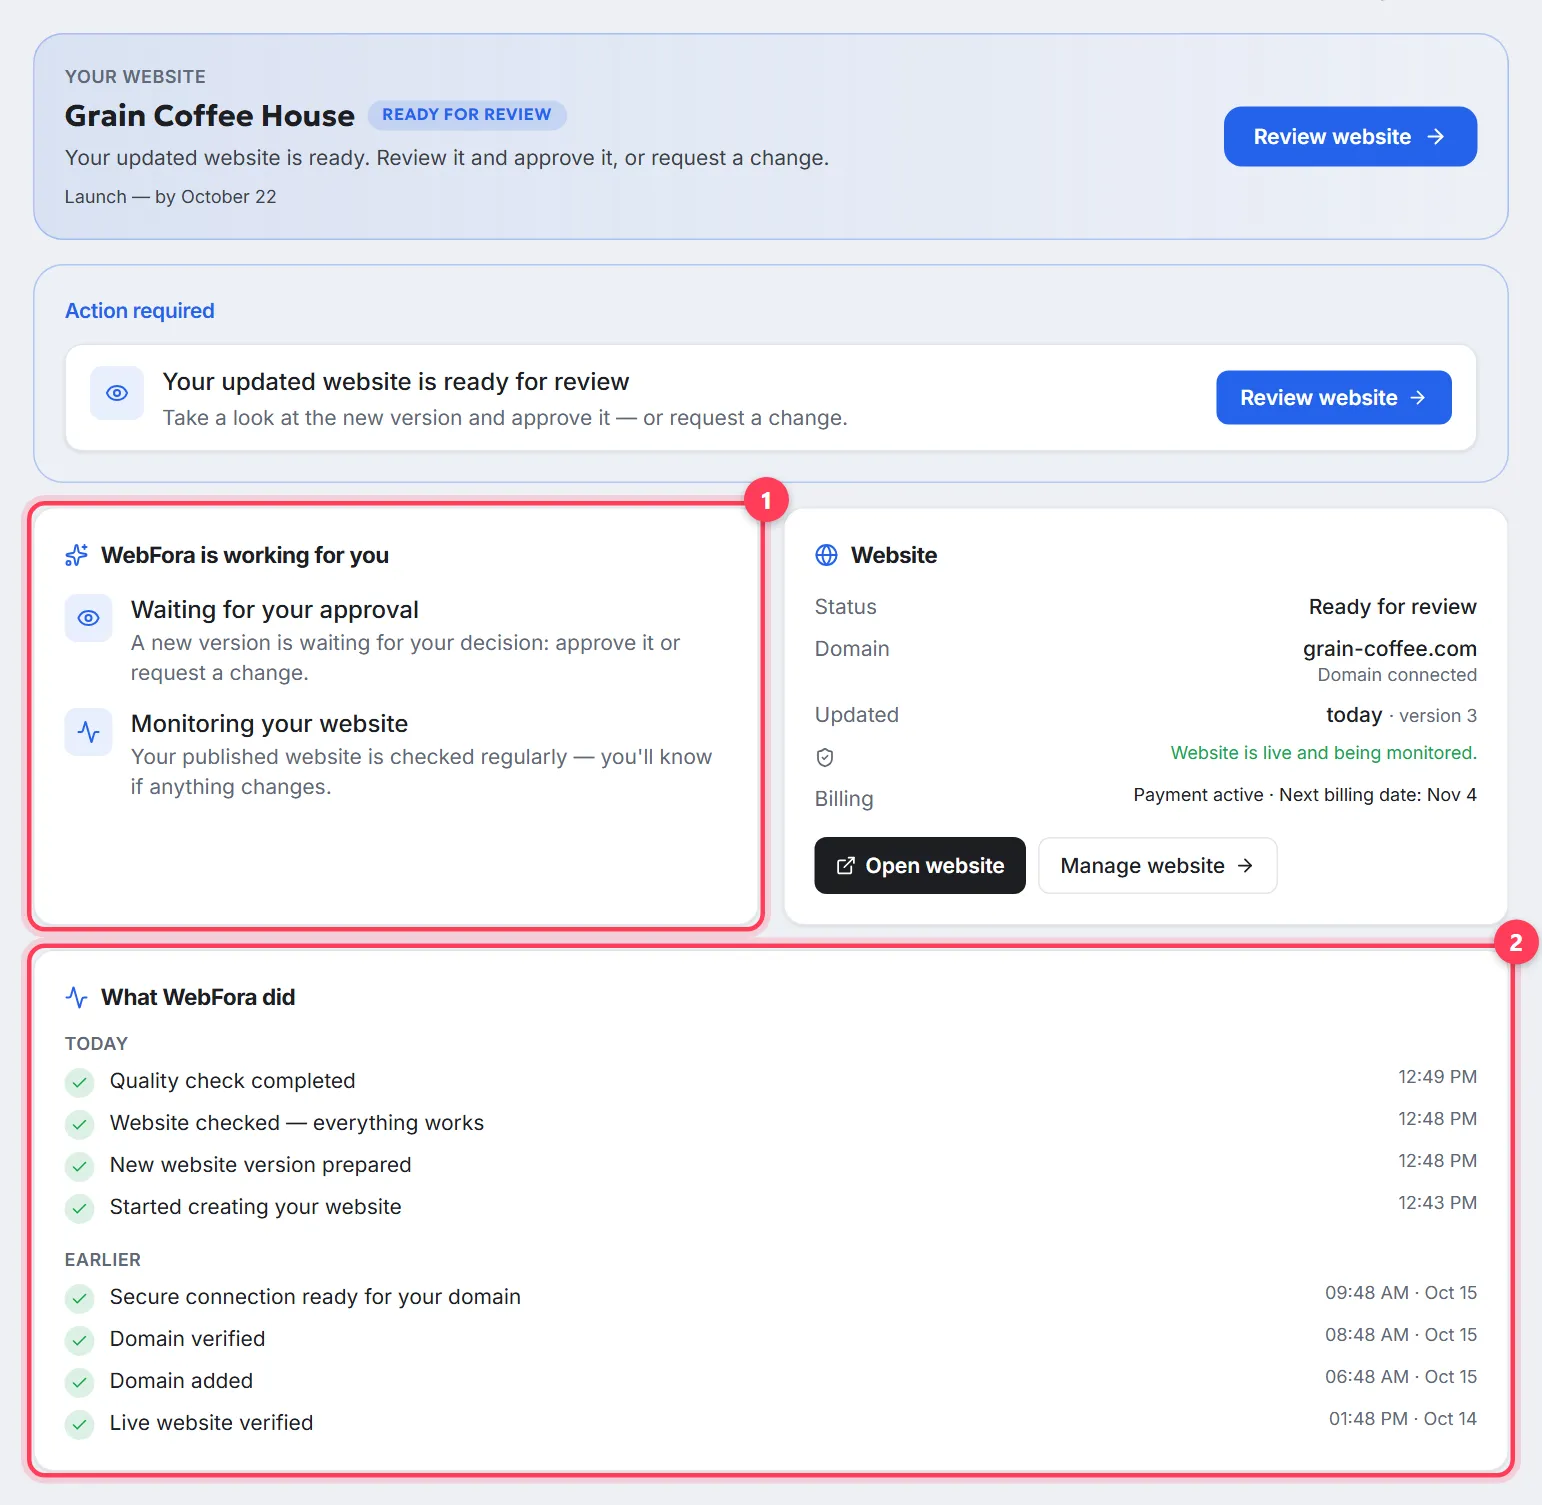
“What WebFora did” is a feed of real events on your website, grouped by day: “Today”, “Yesterday”, “Earlier”. Typical entries: the site creation started, a new version was prepared, the quality check finished, the website was published, the domain was verified, a payment was received. If a check found an issue, the entry carries a warning icon — and the team is already on it.
“Last 30 days”: enquiries, orders, bookings, payments
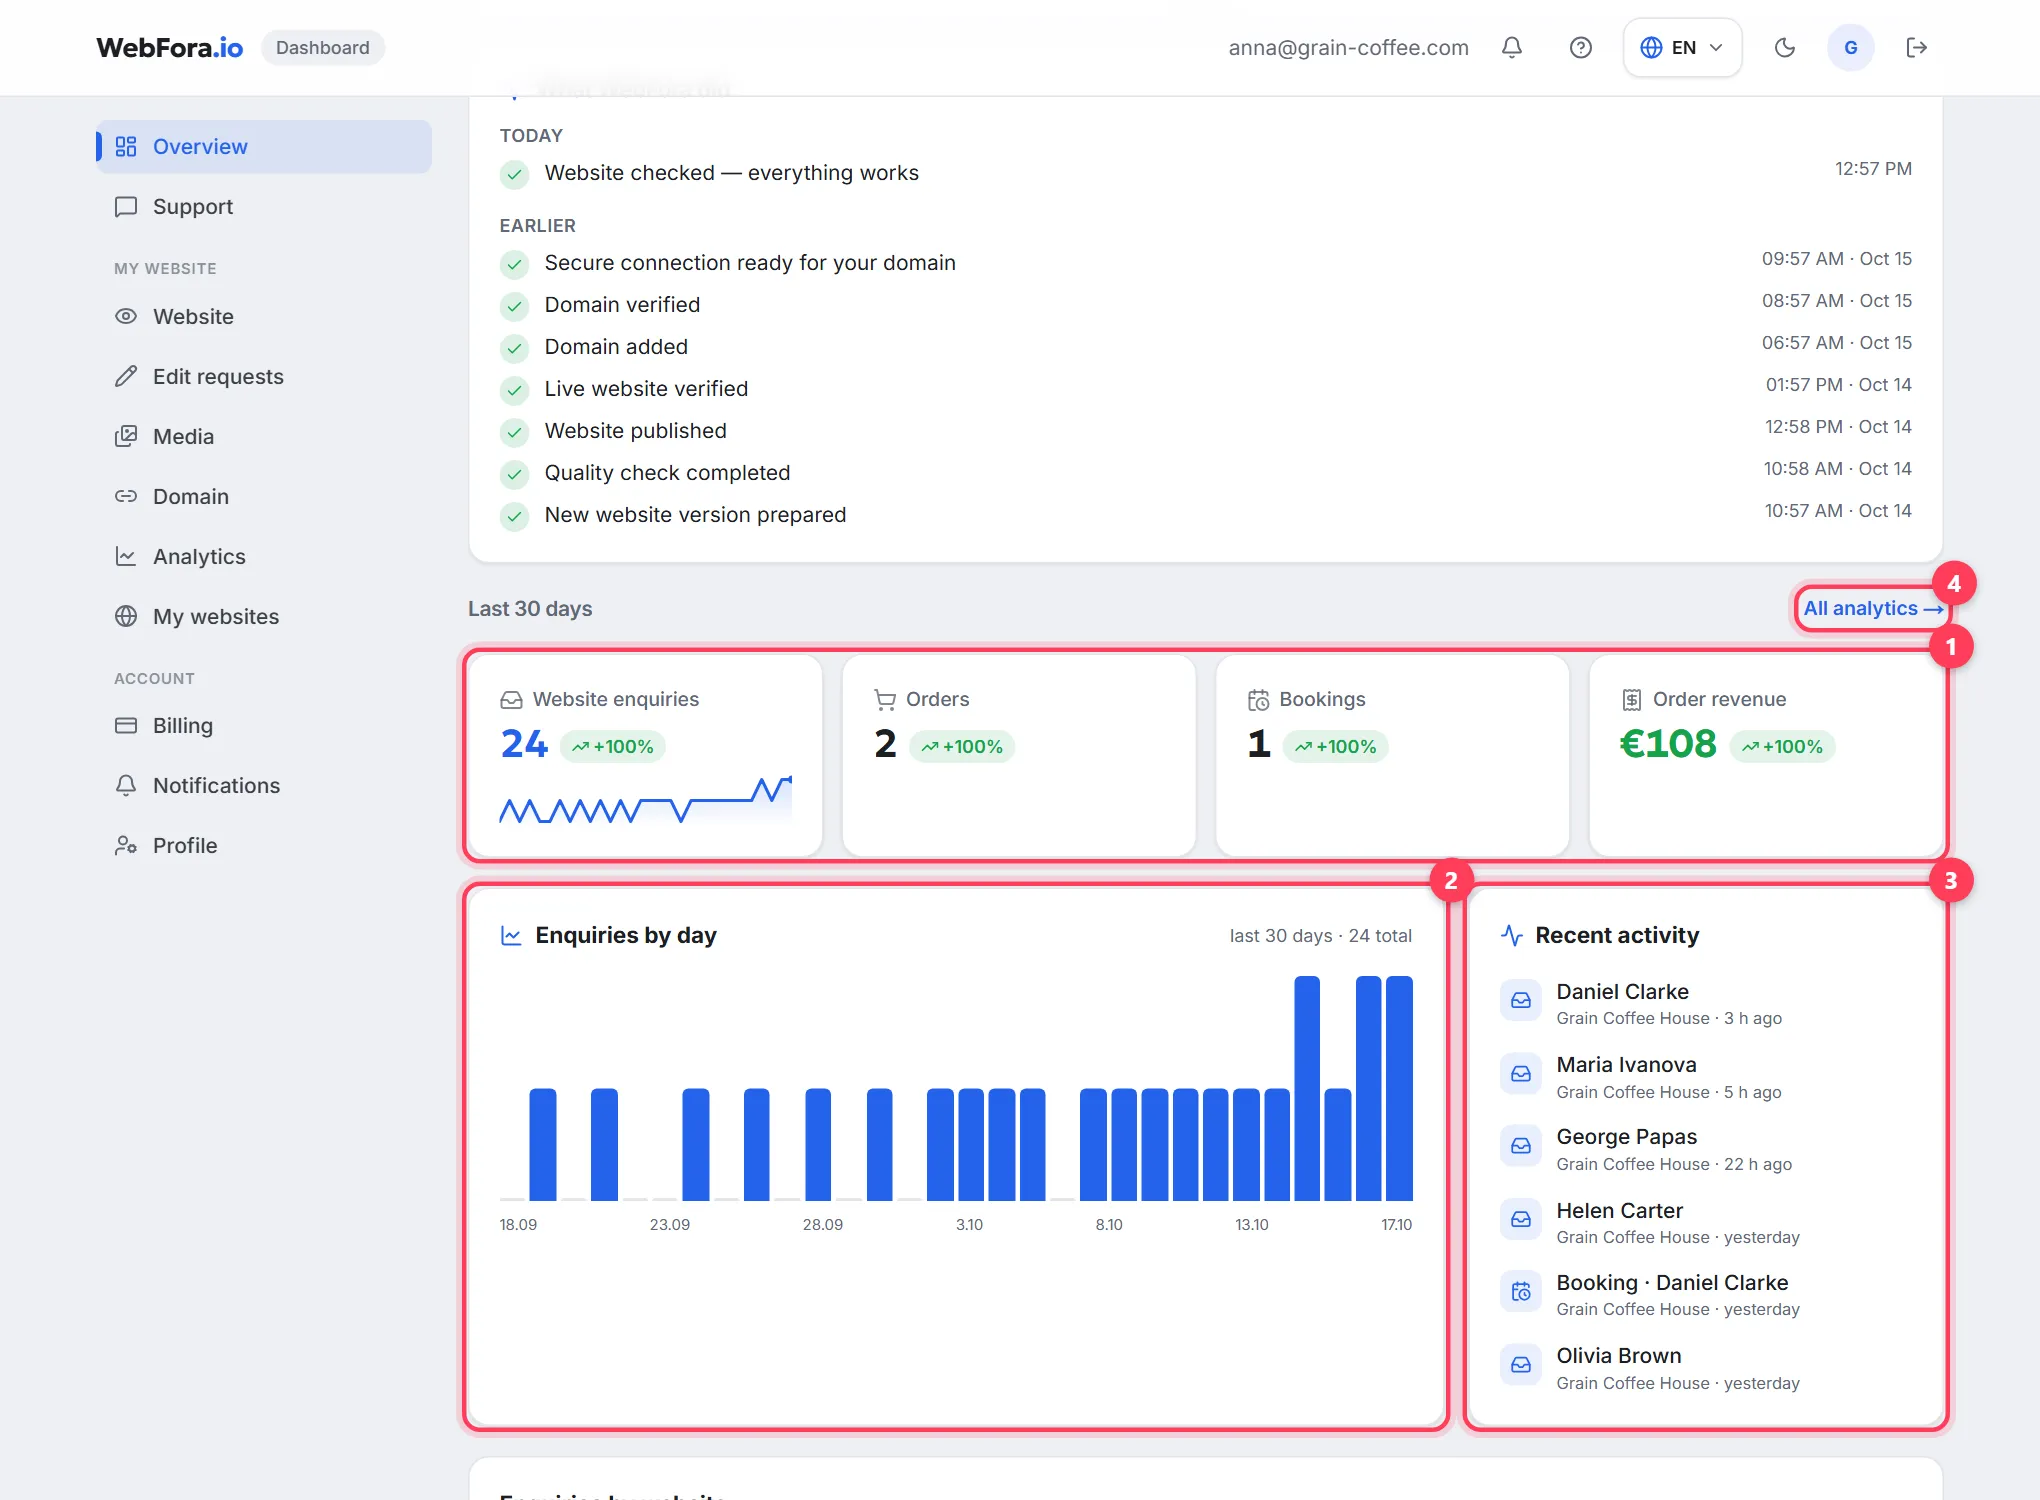
Four cards — “Website enquiries”, “Orders”, “Bookings”, “Payments” — are counted from real data over the last 30 days; the arrow next to each shows the change versus the previous 30 days. Below them: the “Enquiries by day” chart and “Recent activity” (who left an enquiry, order or booking and when). “All analytics →” opens the Analytics section with the funnel, contact channels and the monthly report.
Where to message your manager
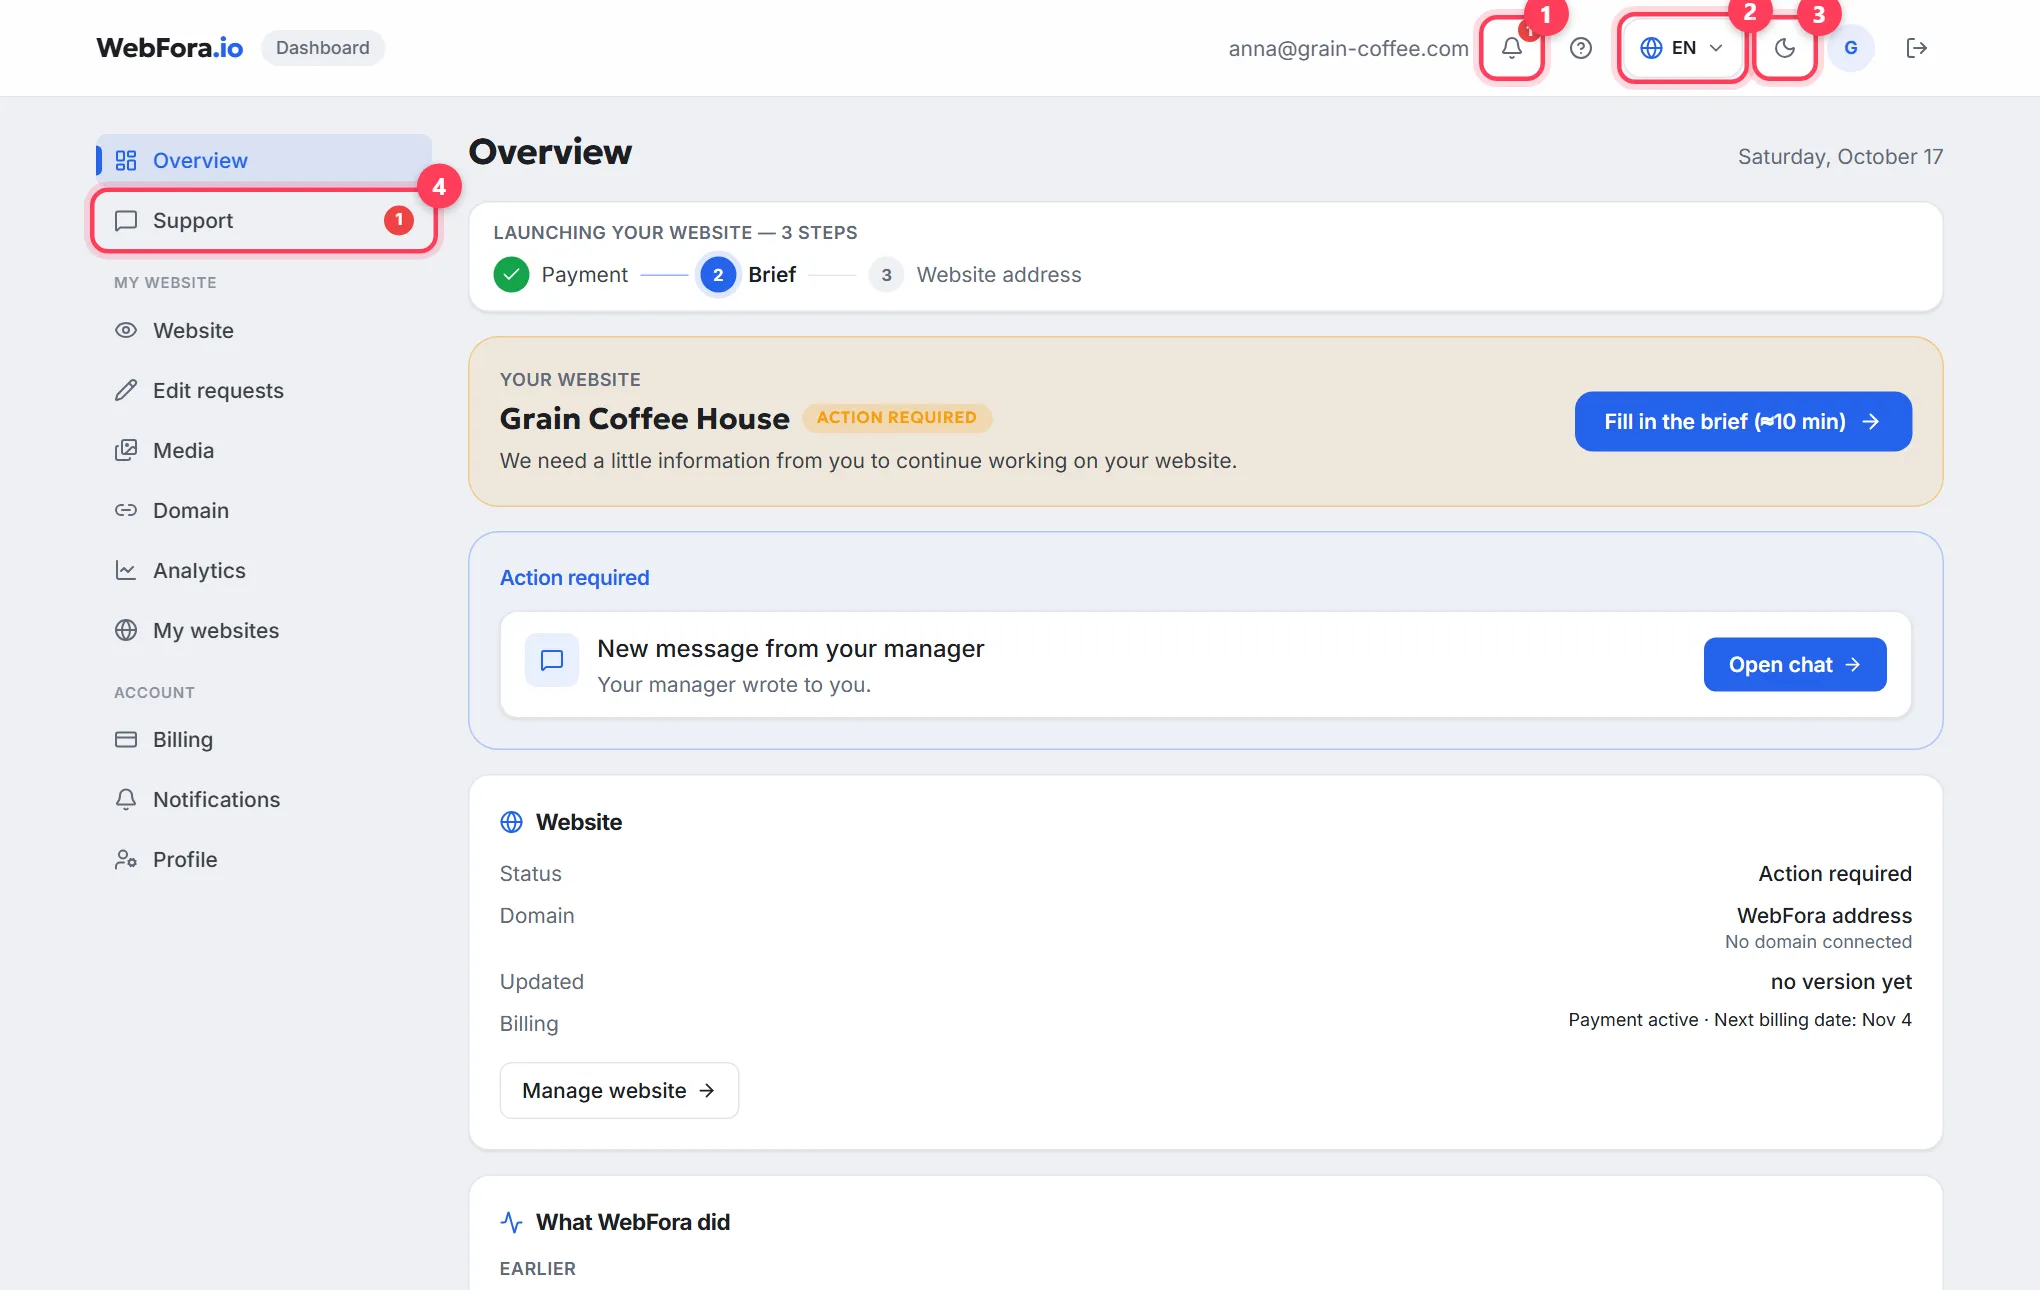
- “Support” in the menu — a direct chat with your manager about your website. Replies come during business hours; you can attach photos or a PDF.
- When your manager writes first, “Overview” shows a “New message from your manager” card with an “Open chat” button, and the “Support” item gets a red counter.
- A question about a specific edit is best asked in the chat under that edit in “Edit requests” — the answer stays with the task.
FAQ
How do I sign in to the WebFora dashboard?+
Use the link from the email you received after ordering, or the sign-in button on webfora.io with the email you ordered with. The dashboard opens on “Overview”.
What does “Action required” mean?+
The team can't continue without you: an invoice is unpaid, the brief isn't filled in, a new version hasn't been reviewed, or your manager is waiting for a reply. The exact step is listed in the “Action required” block with a button.
How do I know my website is live?+
The “Your website” block shows the “Live” label and a green “Open website” button. In the “Website” card, the “Domain” line shows your address, or “WebFora address” if your own domain isn't connected yet.
Where do the “Last 30 days” numbers come from?+
From the enquiries, orders and bookings that came from your website into the dashboard. They are real data, not estimates; each card compares the last 30 days with the previous 30.
I have several websites — how do I switch?+
On “Overview”, buttons with the website names appear above the “Your website” block. In “Support”, “Analytics”, “Media” and “Notifications” the dashboard asks you to pick a website first; the full list with subscriptions is in “My websites”.
Where do I set where enquiries are delivered?+
In “Notifications”: Telegram, email or WhatsApp per website. Email alerts about completed edits and new invoices are switched on in “Profile”.
What is the “Updates” bell?+
A list of events on your projects — payments, ready previews, messages. The red number is the unread count; inside there's a “Mark all as read” button.
Was this guide helpful?
Related guides

How to fill in the website brief
The website brief in your WebFora dashboard: when it opens, sections, address/phone/hours pickers, drafts, the 3-business-day deadline and what comes next.
7 min read
How to review and approve your website before launch
How to review your website before launch in the WebFora dashboard: check the first version on desktop and phone, then request changes or approve it.
6 min read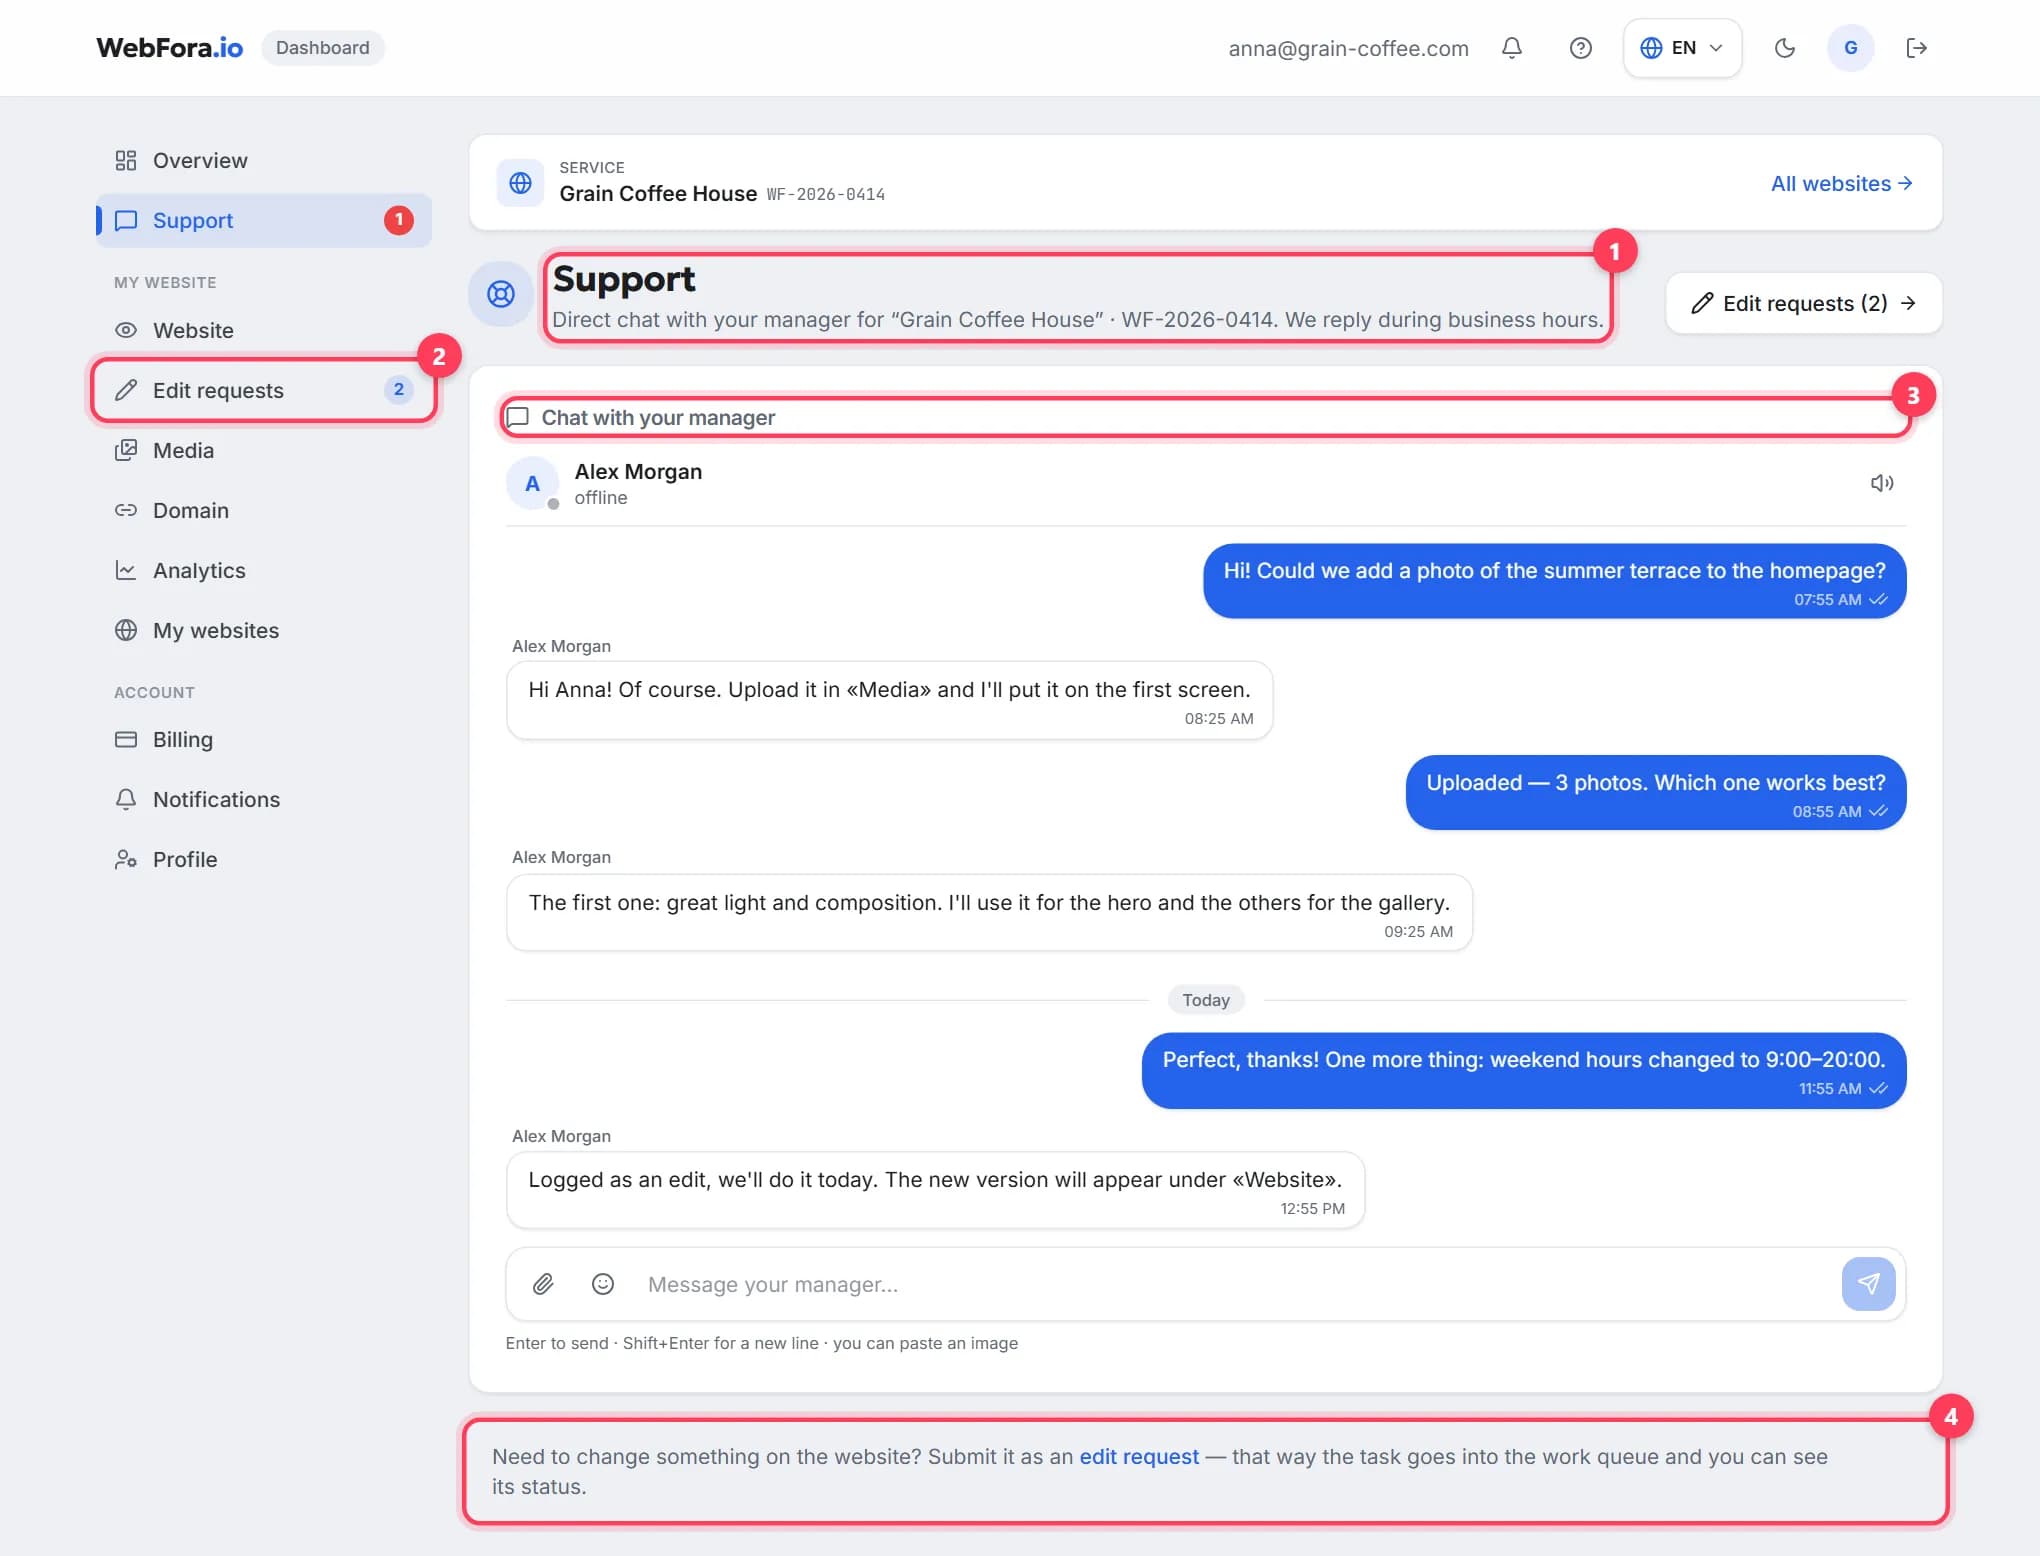
How to message your manager in the chat and get a quick reply
Messaging your WebFora manager: the Support chat, who replies and when, attachments up to 10 MB, chats under edits, what to write for a fast answer.
5 min read