What results to expect from a new website
We show what usually changes for a local business after a redesign and ongoing management with WebFora. These are benchmarks — real client cases are added as they accumulate.
Typical benchmarks, not a guarantee. Real client cases are added as they accumulate.

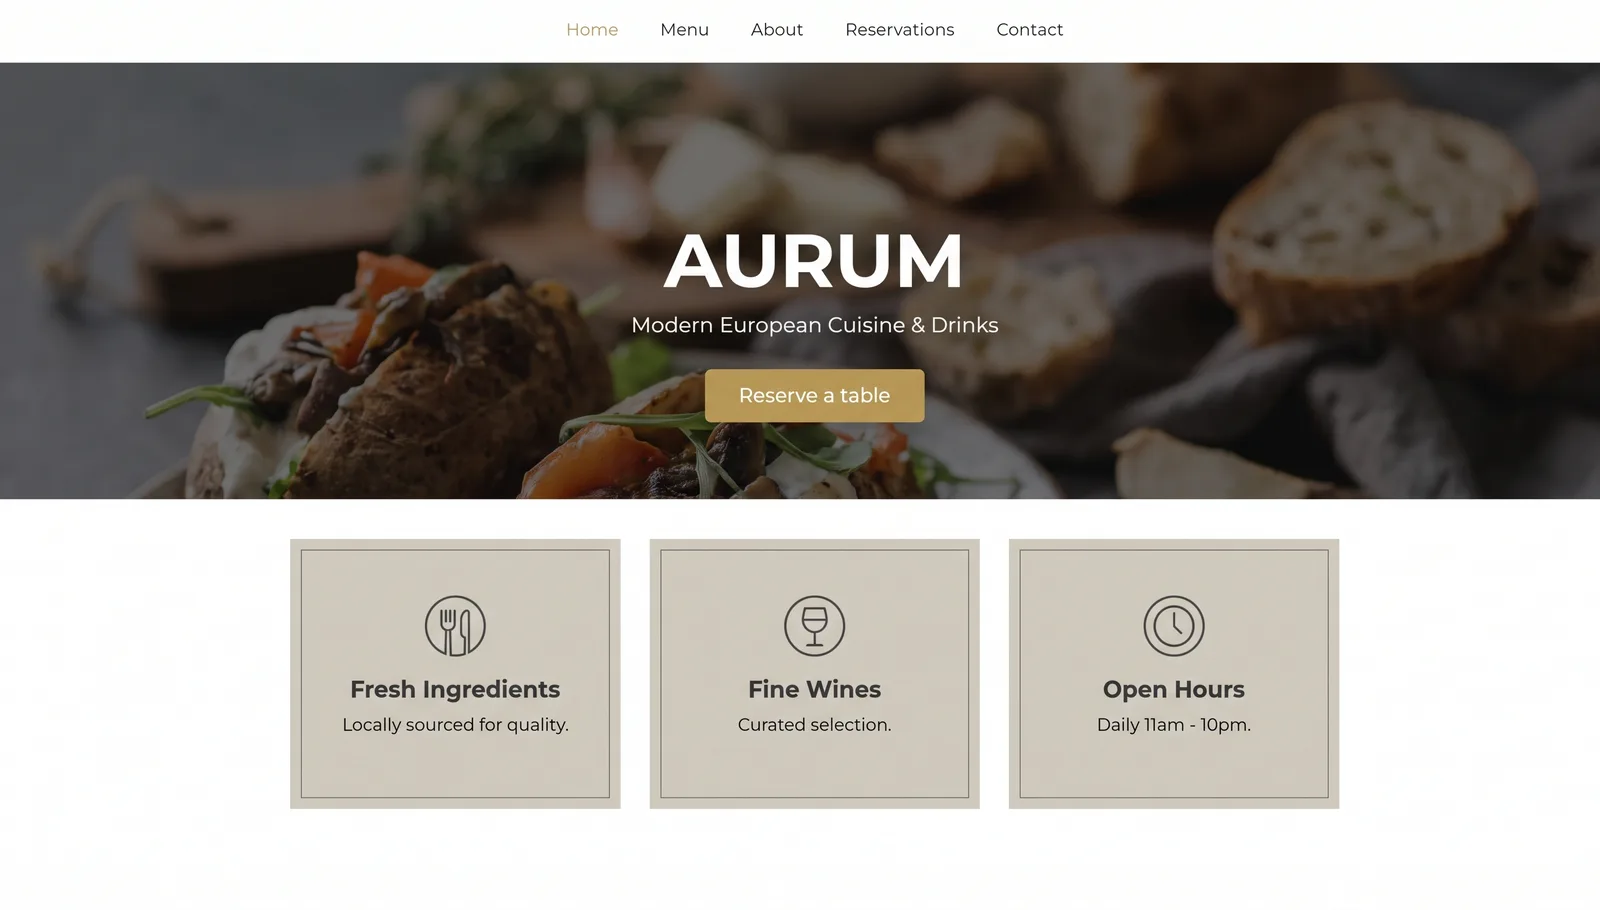
Drag the slider: on the left, a website in a typical 2020 style; on the right, a modern 2026 design. An example of our design approach, not a real client.
We count results in clients, not in “traffic”
Enquiries, conversion, speed, Google rankings and the conversion score — we record “before → after” every month so the result is visible in numbers, not just words.
Typical results by niche
These are benchmarks based on typical figures for local businesses, not the results of a specific client. Real cases with names and numbers are published as they accumulate.
A new website with online booking and local SEO — slots fill up in advance.
A clear website, trust from the first screen and promotion by service and area.
An appetising website with a menu and reservations, maps and social media.
How we measure “before → after”
We record a baseline
Before starting we capture the figures: conversion score, speed (Core Web Vitals), rankings for key queries and the current flow of enquiries.
We measure with tools, not by eye
Google Analytics 4, Search Console and PageSpeed — you see the same data in your client cabinet; we don’t draw our own numbers.
We compare every month
The monthly report shows progress against the baseline in plain language: enquiries, rankings, speed. You can see what is growing and what is still in progress.
What usually changes, and when
Honestly: SEO is not an instant channel. Here is the typical trajectory for a local business (a benchmark, not a guarantee):
The new website is live: higher speed and conversion, enquiries come from existing traffic. Your Google Business profile is set up.
Google re-indexes the website: first movements in rankings for local and niche queries, more calls from maps.
Local queries settle in, organic traffic and enquiries grow — the effect compounds with every month of management.
Your case could appear here
We publish only real cases with real numbers — and only with the client’s consent. Want to know your own “baseline”? Start with a free audit: you will learn your website score and what can be improved.

Find out your starting point
A free audit will show your website’s conversion score and top issues — that is the point we measure growth from.