Website analytics: what the numbers mean for a business owner
Website analytics in the WebFora dashboard shows real data only: how many enquiries came in over 7, 30 or 90 days, how many you handled, how people contact you and when they write most. Traffic, sources and search rankings appear once an external source (Google Analytics 4, Search Console) is connected — no “estimated” figures. The printable “Monthly report” gathers it all on one page.
Where to find analytics
The “Analytics” section in the “My website” group (address /dashboard/analytics); with several websites, pick one first. Top right: the period switch “7 days” / “30 days” / “90 days” / “All time” (30 days by default) and the “Monthly report” button. A short version of the same numbers is on Overview as “Last 30 days”.
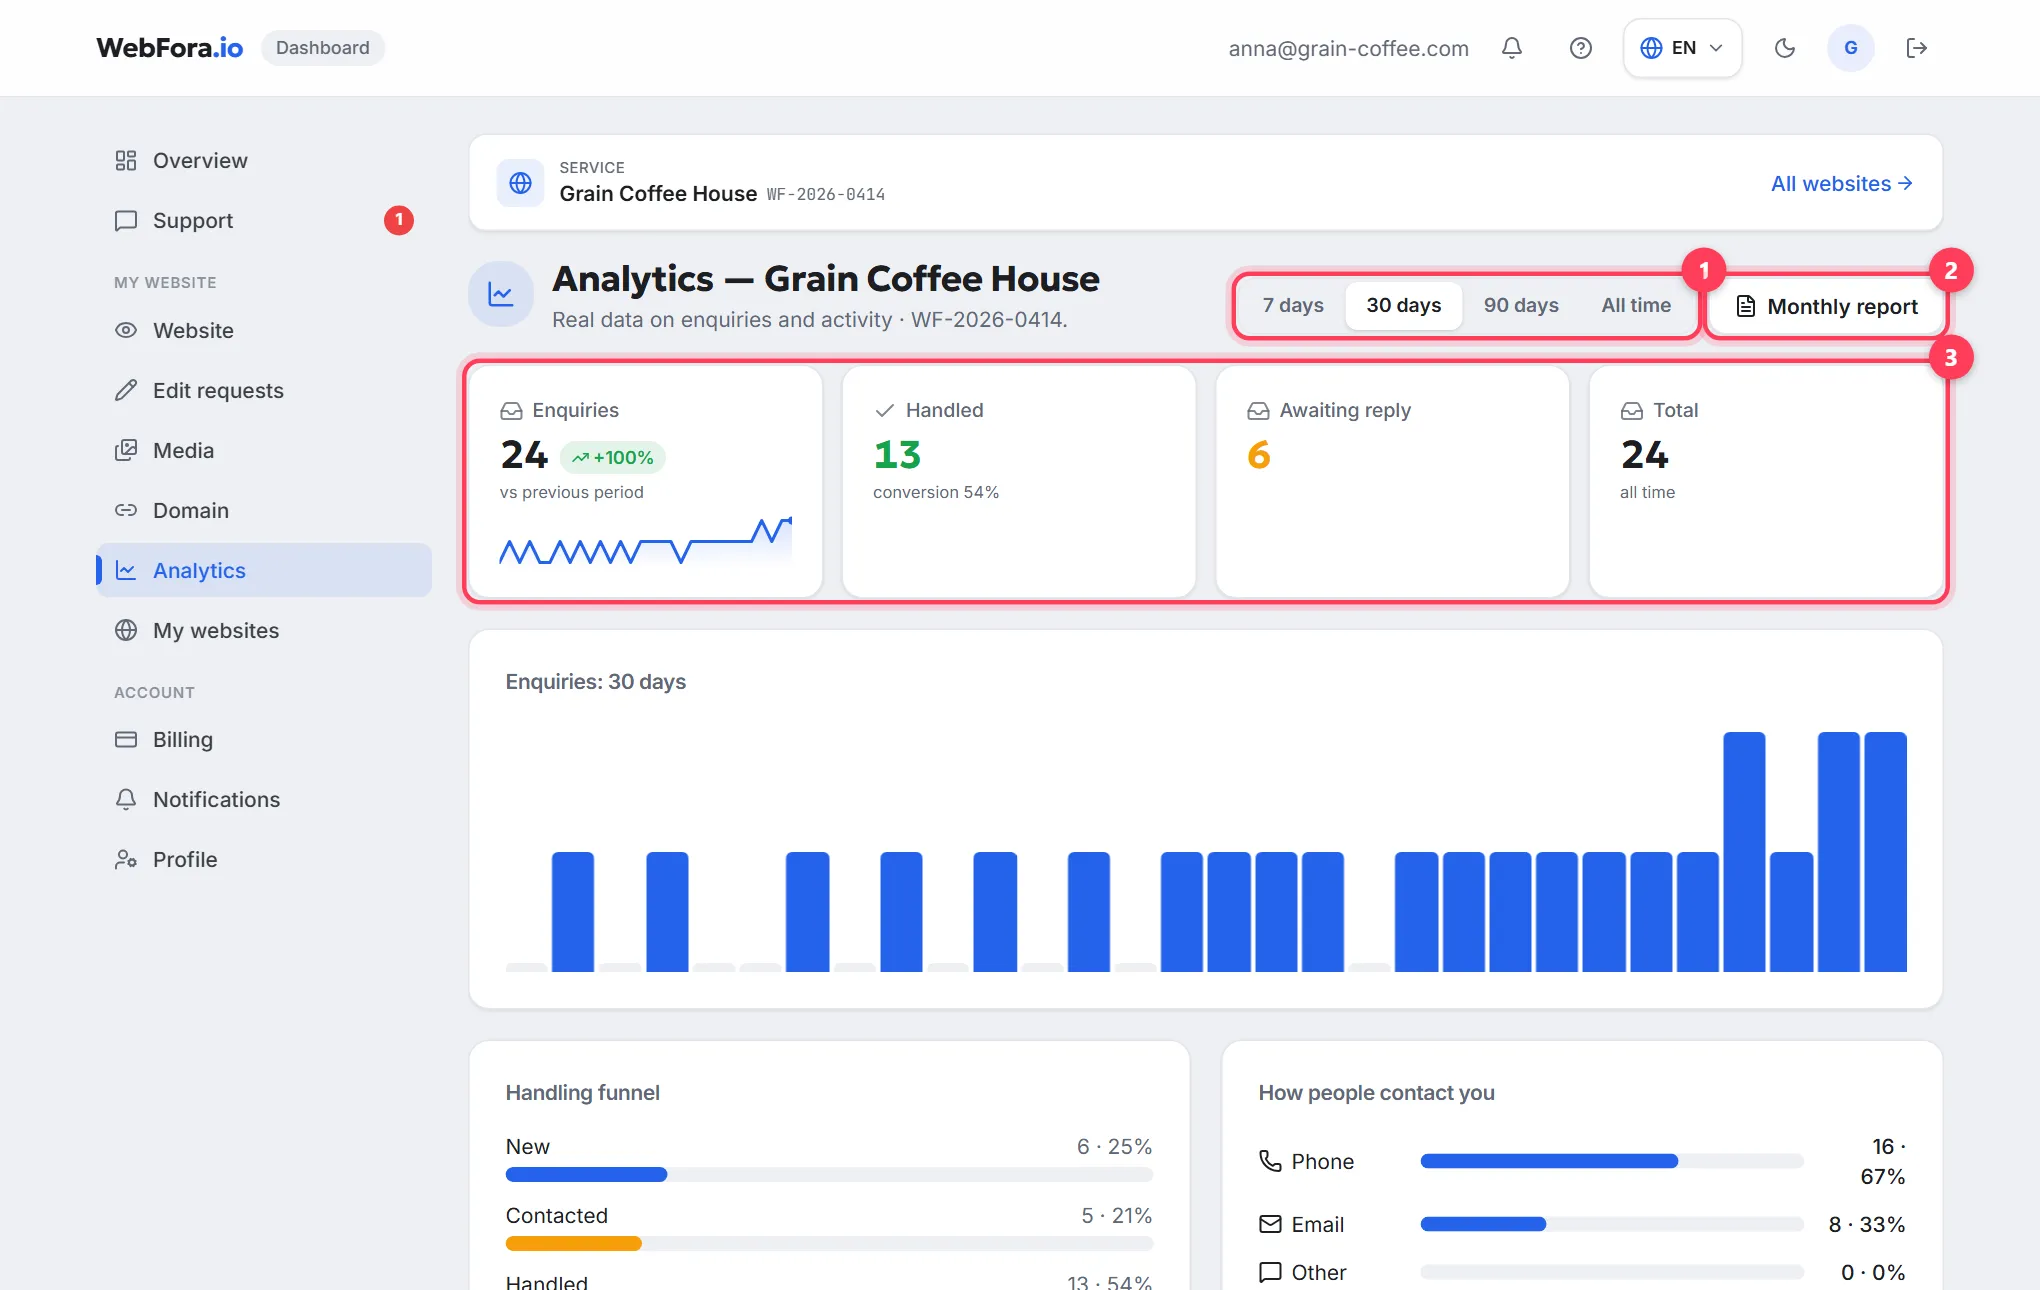
The four headline numbers
| Card | What it means for the business |
|---|---|
| Enquiries | How many people left their contact details through the website in the period. The arrow and “vs previous period” compare with the same stretch before it: +30% means the site brings more |
| Handled | How many enquiries you moved to the “Handled” stage in the CRM pipeline; “conversion N%” next to it is the share of all enquiries. Low conversion usually points at reply speed, not at the website |
| Awaiting reply | Enquiries still in the “New” stage. Anything above zero means customers nobody has answered yet |
| Total | Enquiries over the whole life of the website |
The charts below: when and how people contact you
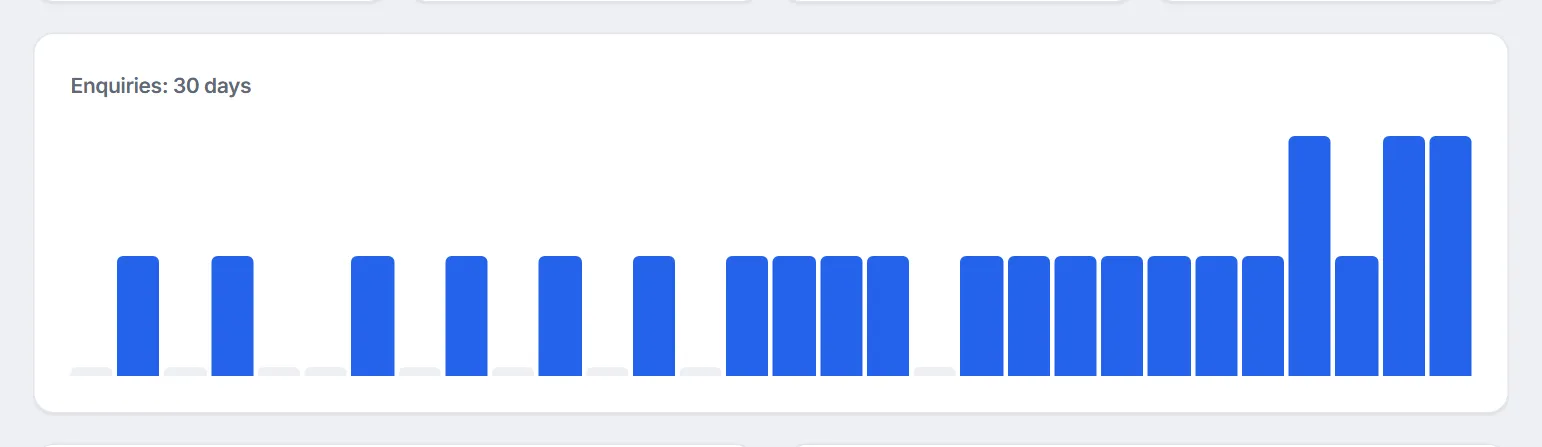
- “Enquiries: period” — bars by day (up to 31 days), week or month. Dips on particular days often match weekends or a pause in advertising.
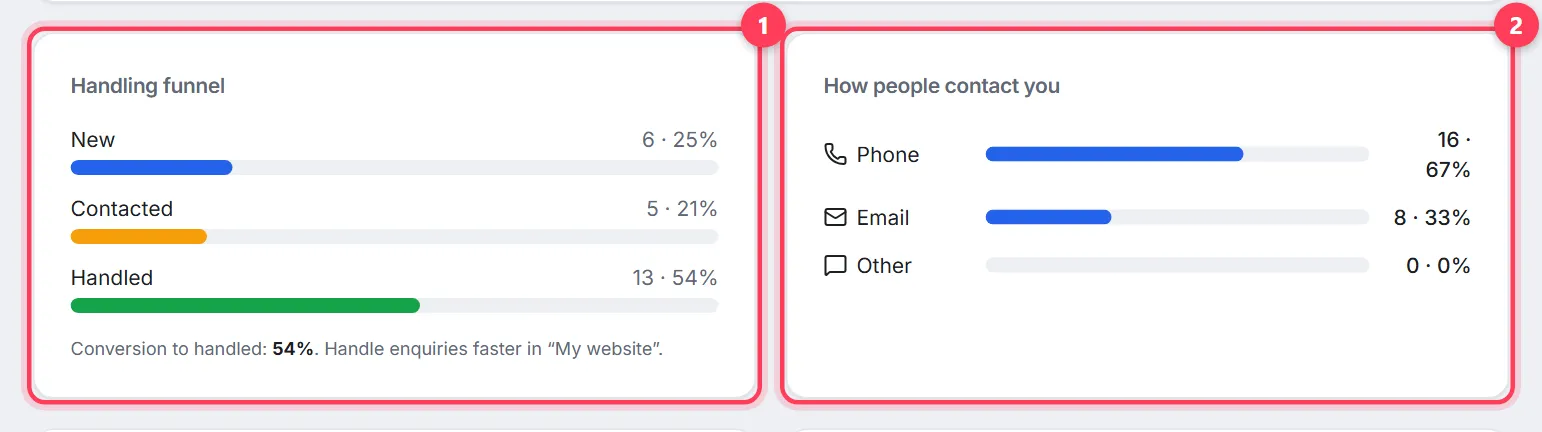
- “Handling funnel” — three bars, “New”, “Contacted”, “Handled”, with percentages. The caption says it plainly: “Conversion to handled: N%. Handle enquiries faster”.
- “How people contact you” — the share of enquiries with a phone number, an email and “Other”. If most leave a phone number and you reply by email, you're losing time.
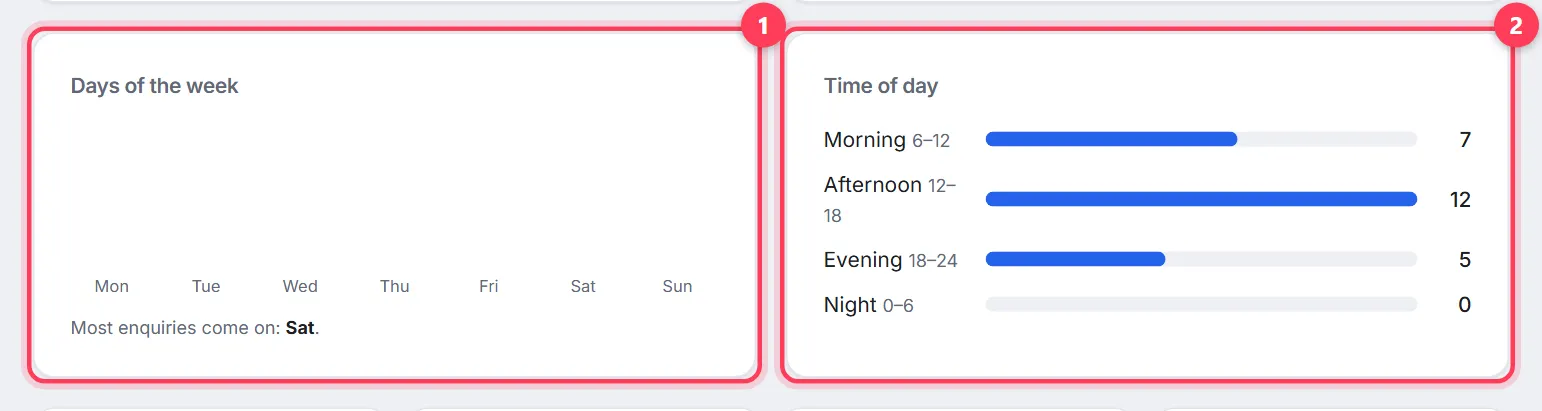
- “Days of the week” and “Time of day” (Morning 6–12, Afternoon 12–18, Evening 18–24, Night 0–6) — when people write most. “Most enquiries come on: …” tells you when to keep the phone close or when to run ads.
- Four mini cards: “Open edit requests”, “Chat messages”, “Enquiries per week”, “In progress” (new + contacted).

Traffic, sources, SEO and geography: where they come from
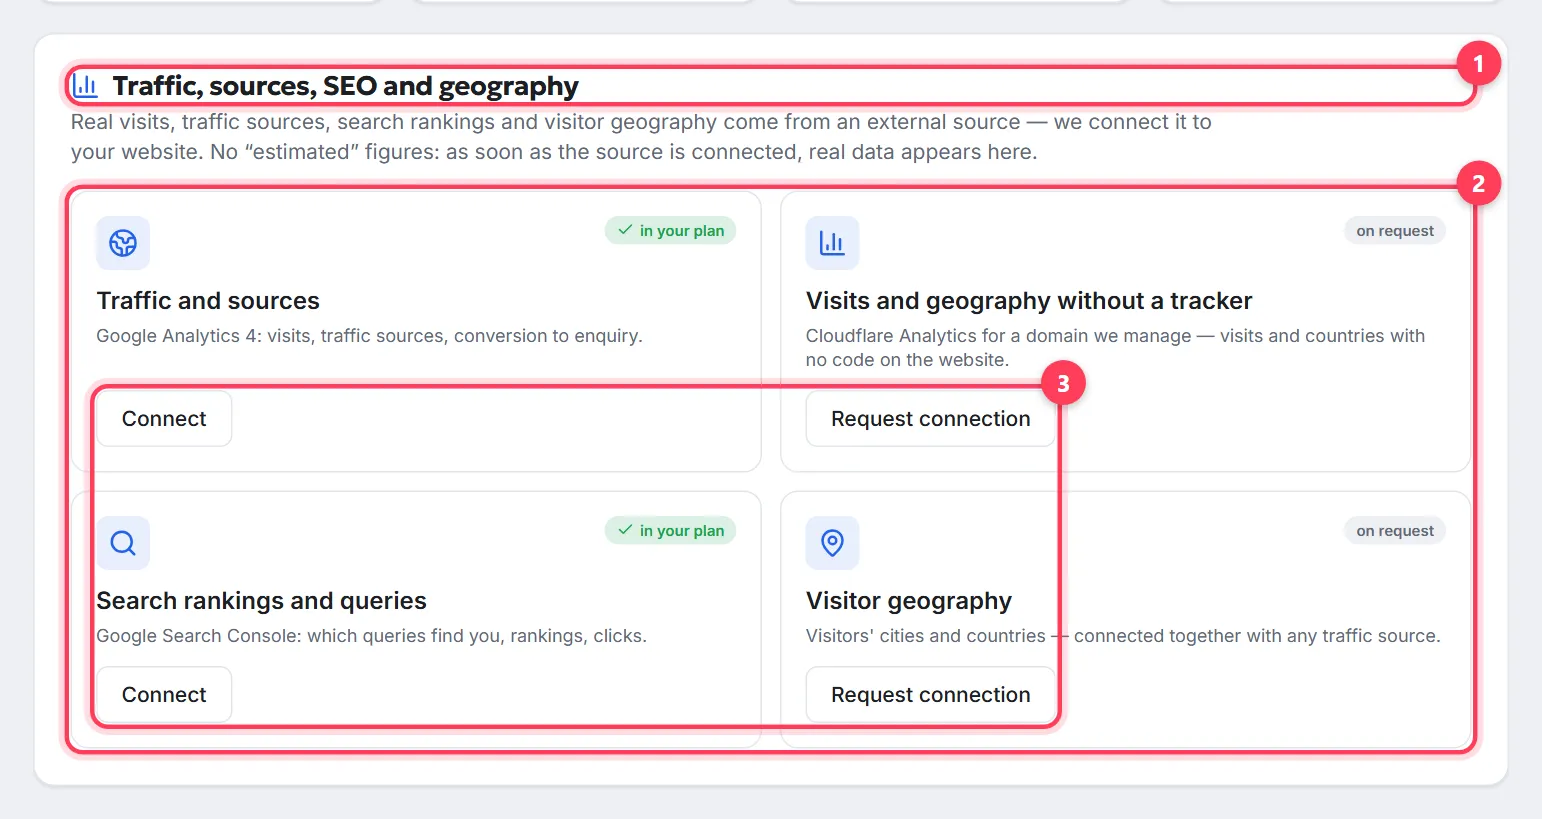
The bottom block, “Traffic, sources, SEO and geography”, says it honestly: visits, traffic sources, search rankings and visitor geography come from an external source the team connects to your website. Until it's connected, the dashboard shows no “estimated” numbers at all.
| Card | What it gives | How to connect |
|---|---|---|
| Traffic and sources | Google Analytics 4: visits, traffic sources, conversion to enquiry | “in your plan” → “Connect”; otherwise the “module” badge → “Add module” |
| Visits and geography without a tracker | Cloudflare Analytics for a domain WebFora manages — visits and countries with no code on the site | “on request” → “Request connection” |
| Search rankings and queries | Google Search Console: which queries find you, rankings, clicks | “in your plan” with the SEO module → “Connect”; otherwise “Add module” |
| Visitor geography | Visitors' cities and countries | “on request” → “Request connection” |
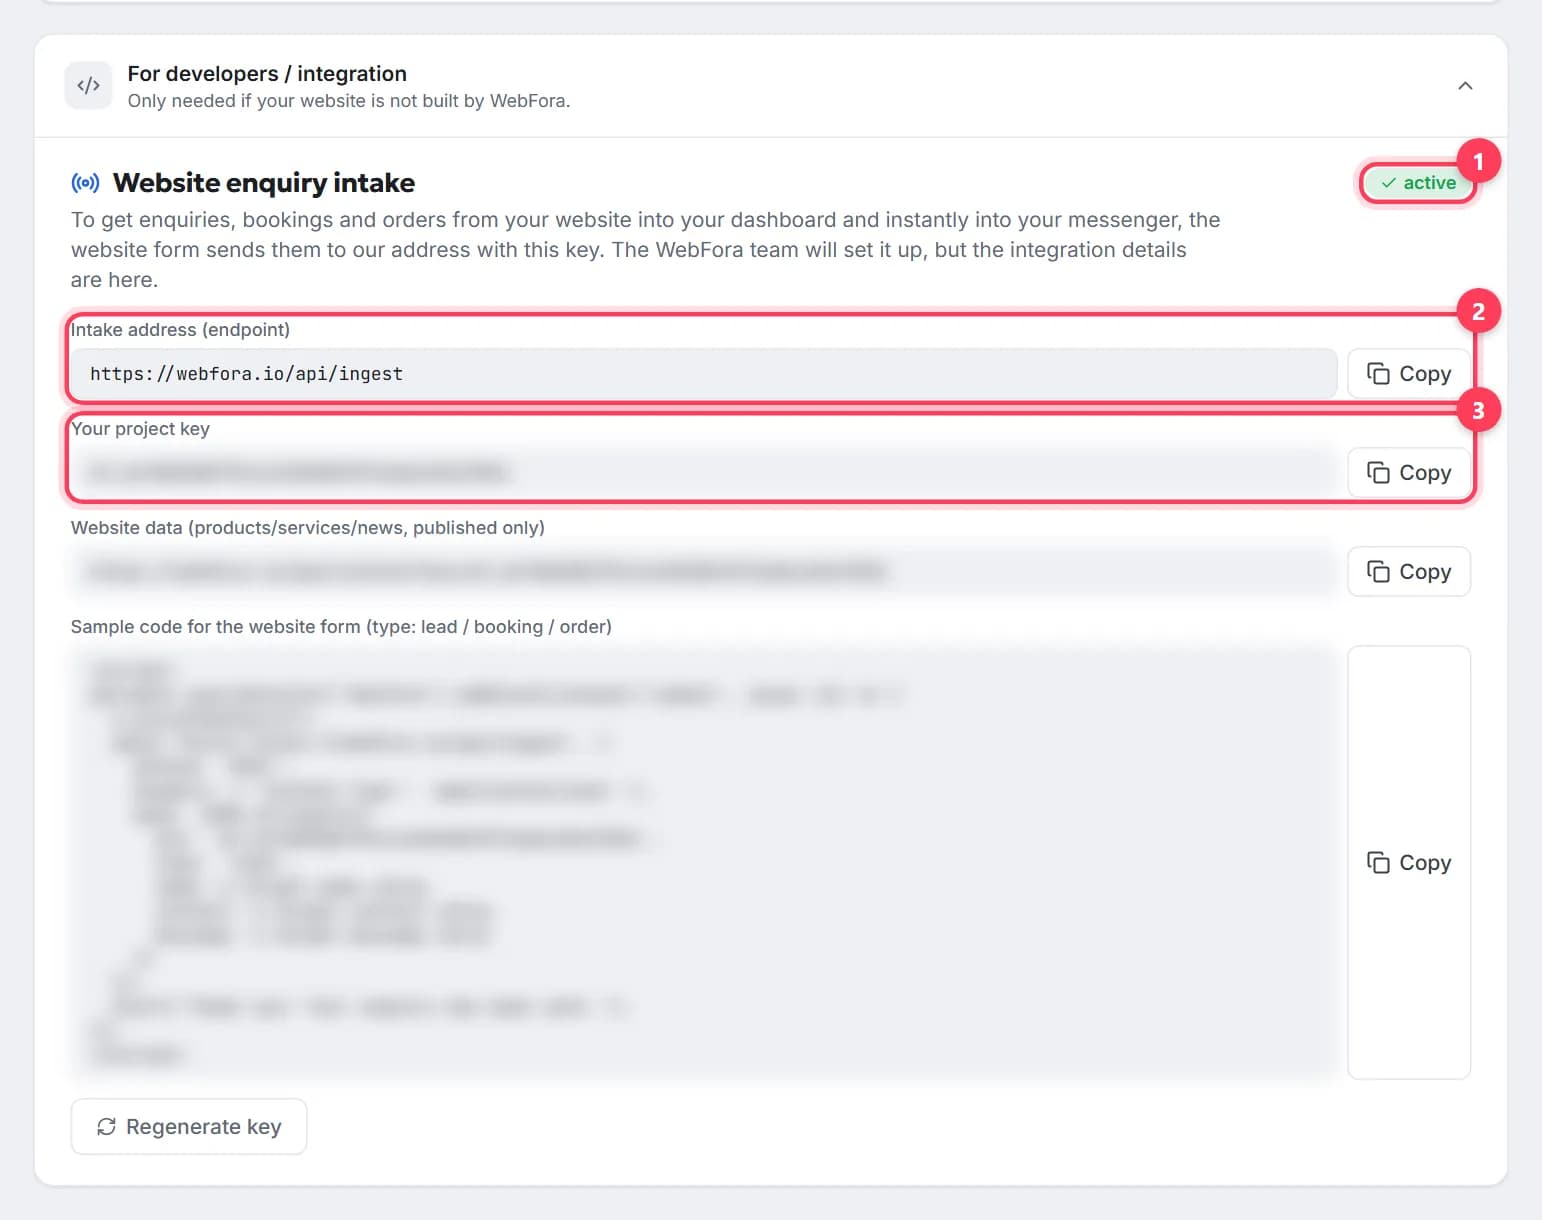
After pressing, you'll see “Request sent — your manager will connect the source, and real data will appear here”. If you already have a tracker, its ID could be given in the brief (the “Analytics” section) — or send it to your manager in the chat.
“Monthly report”: one page for you or your accountant
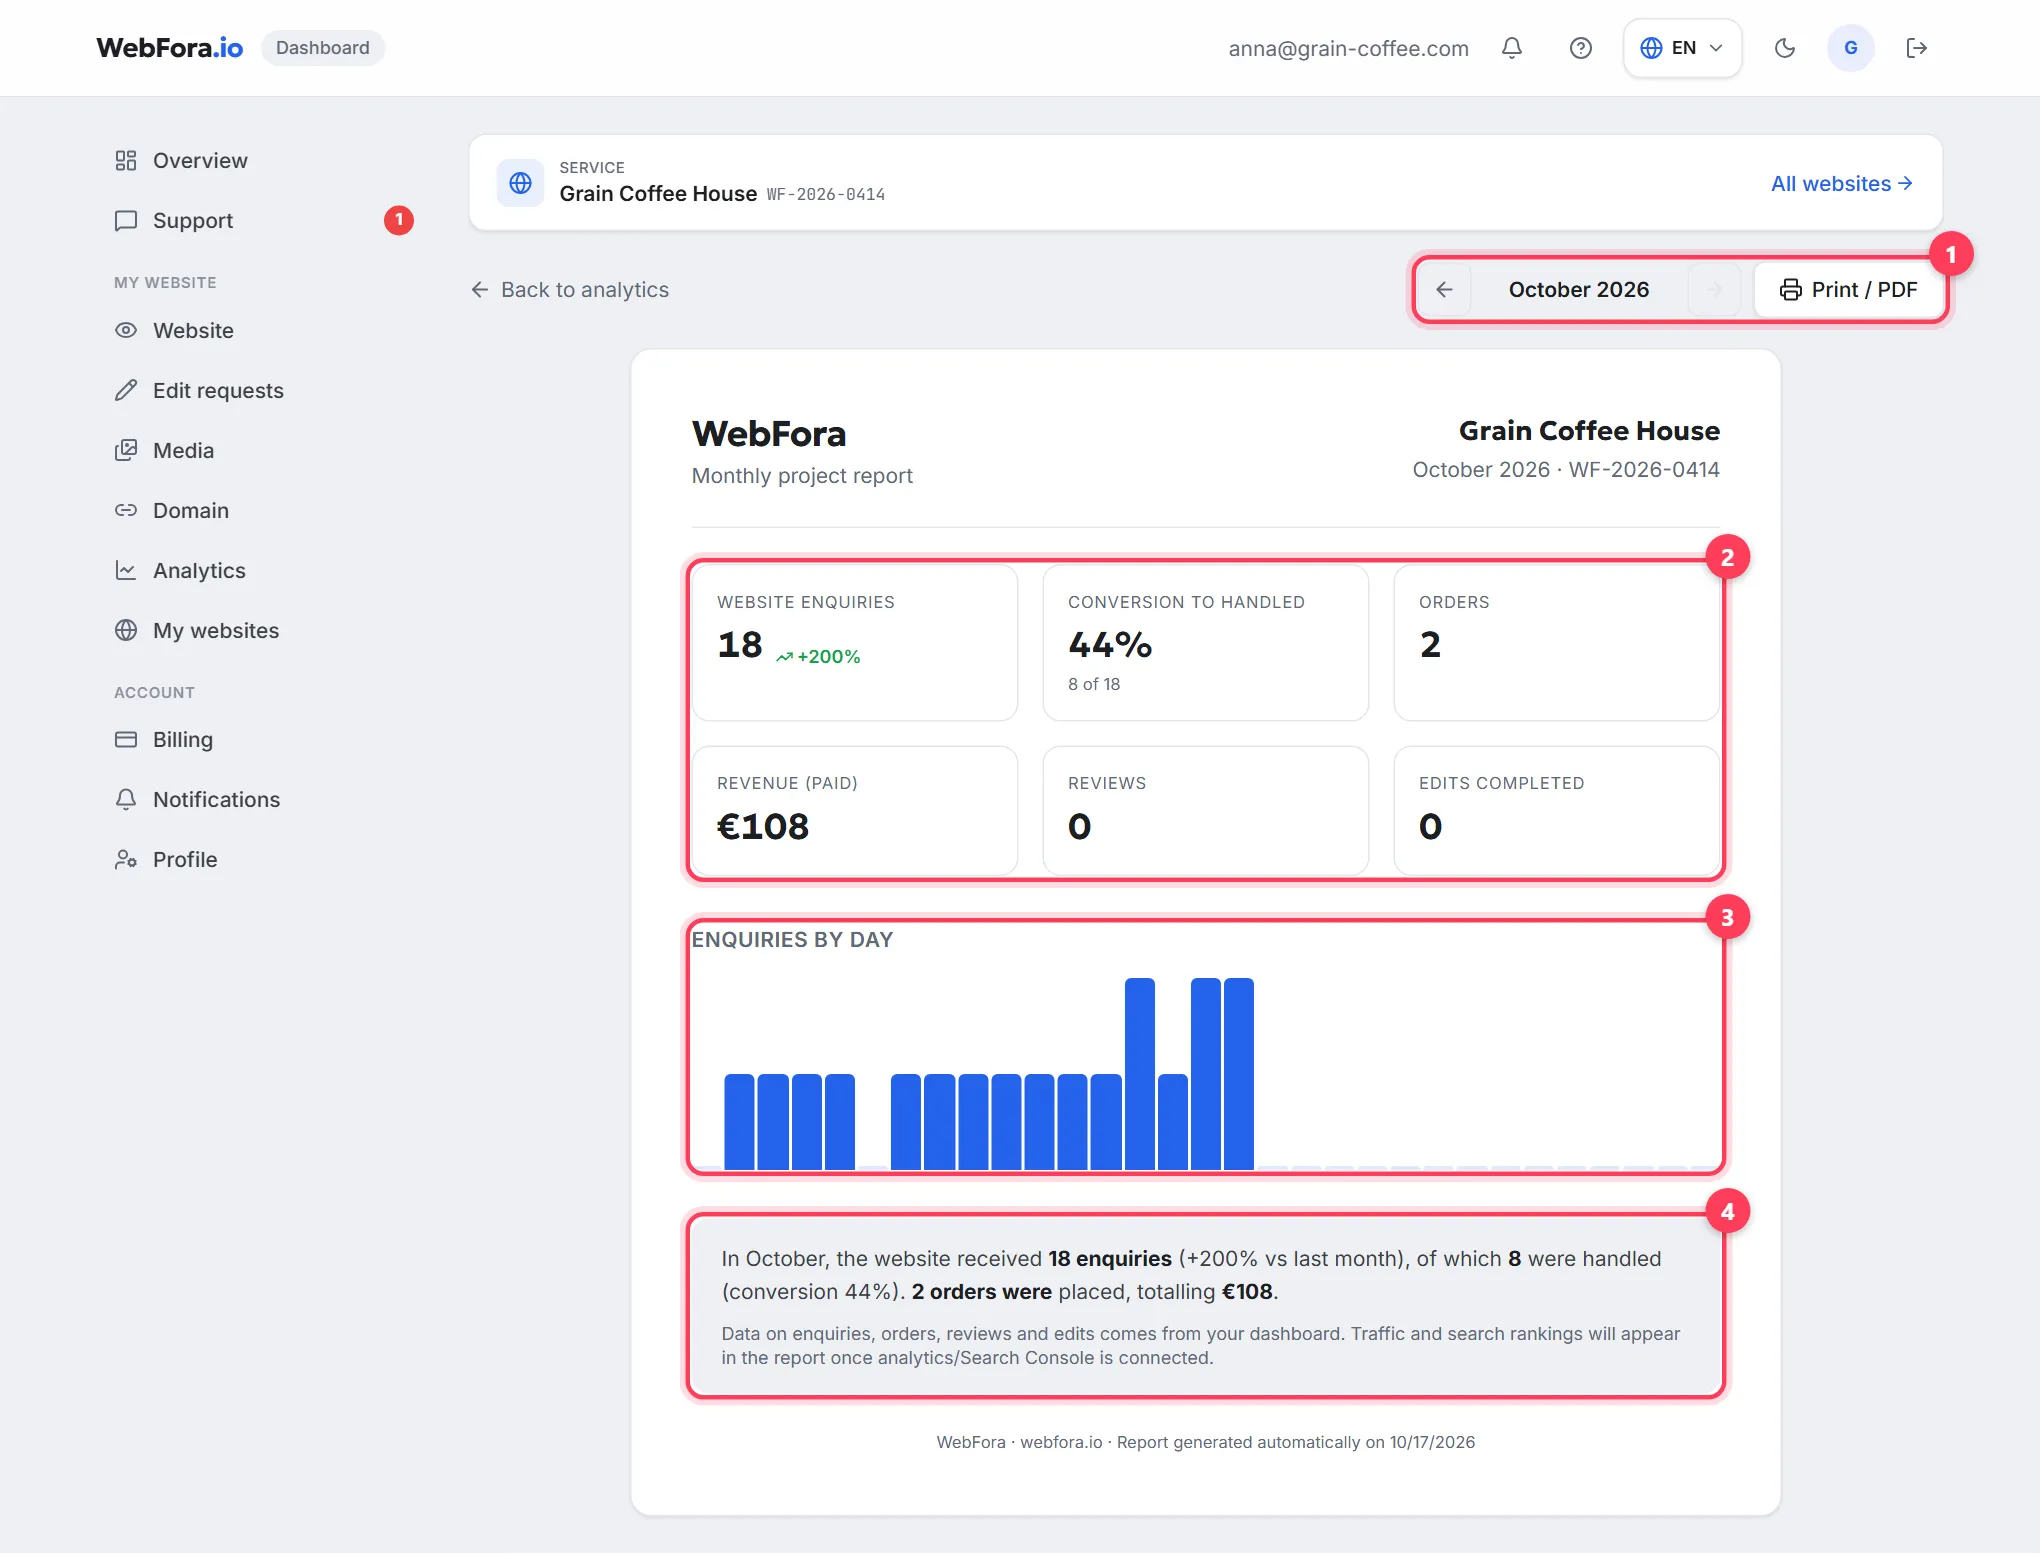
The “Monthly report” button opens a printable page (address /dashboard/report): arrows switch months, the print button saves it as PDF. The report has six numbers — “Website enquiries” (with the change versus last month), “Conversion to handled”, “Orders”, “Revenue (paid)” (for websites with a shop), “Reviews” (with the average rating) and “Edits completed” — the “Enquiries by day” chart and a summary in words: “In October the website brought 14 enquiries (+40% vs last month), 11 of them handled (79% conversion)”.
FAQ
Why is there no traffic in my analytics?+
Traffic comes from an external source (Google Analytics 4 or Cloudflare Analytics) connected by the team. Press “Connect” / “Request connection” in the “Traffic, sources, SEO and geography” block — the dashboard never shows estimated figures.
What is conversion in WebFora analytics?+
The share of enquiries moved to the “Handled” stage in the CRM pipeline out of all enquiries in the period. It's handling conversion, not “visitors → enquiries” — the latter appears after a tracker is connected.
How do I compare this month with the last one?+
In Analytics, the “Enquiries” card shows the change “vs previous period” for 7, 30 and 90 days. In the Monthly report, the percentage next to the enquiry count compares with the previous month, and the arrows switch months.
Where do “Orders” and “Revenue” come from?+
From orders placed through the shop on your website: “Revenue (paid)” counts only orders with a paid/shipped/done status. Without the shop module they stay at zero.
Can I export the report?+
Yes — the Monthly report page has a print button: save it as PDF through your browser's print dialog.
How do I see which Google queries bring people to my site?+
Through Google Search Console — the “Search rankings and queries” card. It's “in your plan” with the SEO module (press “Connect”), otherwise available via “Add module”.
Why are there many enquiries but “Handled” is zero?+
“Handled” counts the cards you moved to the “Handled” column in the CRM pipeline. Move enquiries through the stages and the numbers become true.
Was this guide helpful?
Related guides
Website enquiries: where they land and how to get notified
Where website enquiries land in the WebFora dashboard, New → Contacted → Handled stages, Telegram, email and WhatsApp alerts, the test message and reviews.
6 min read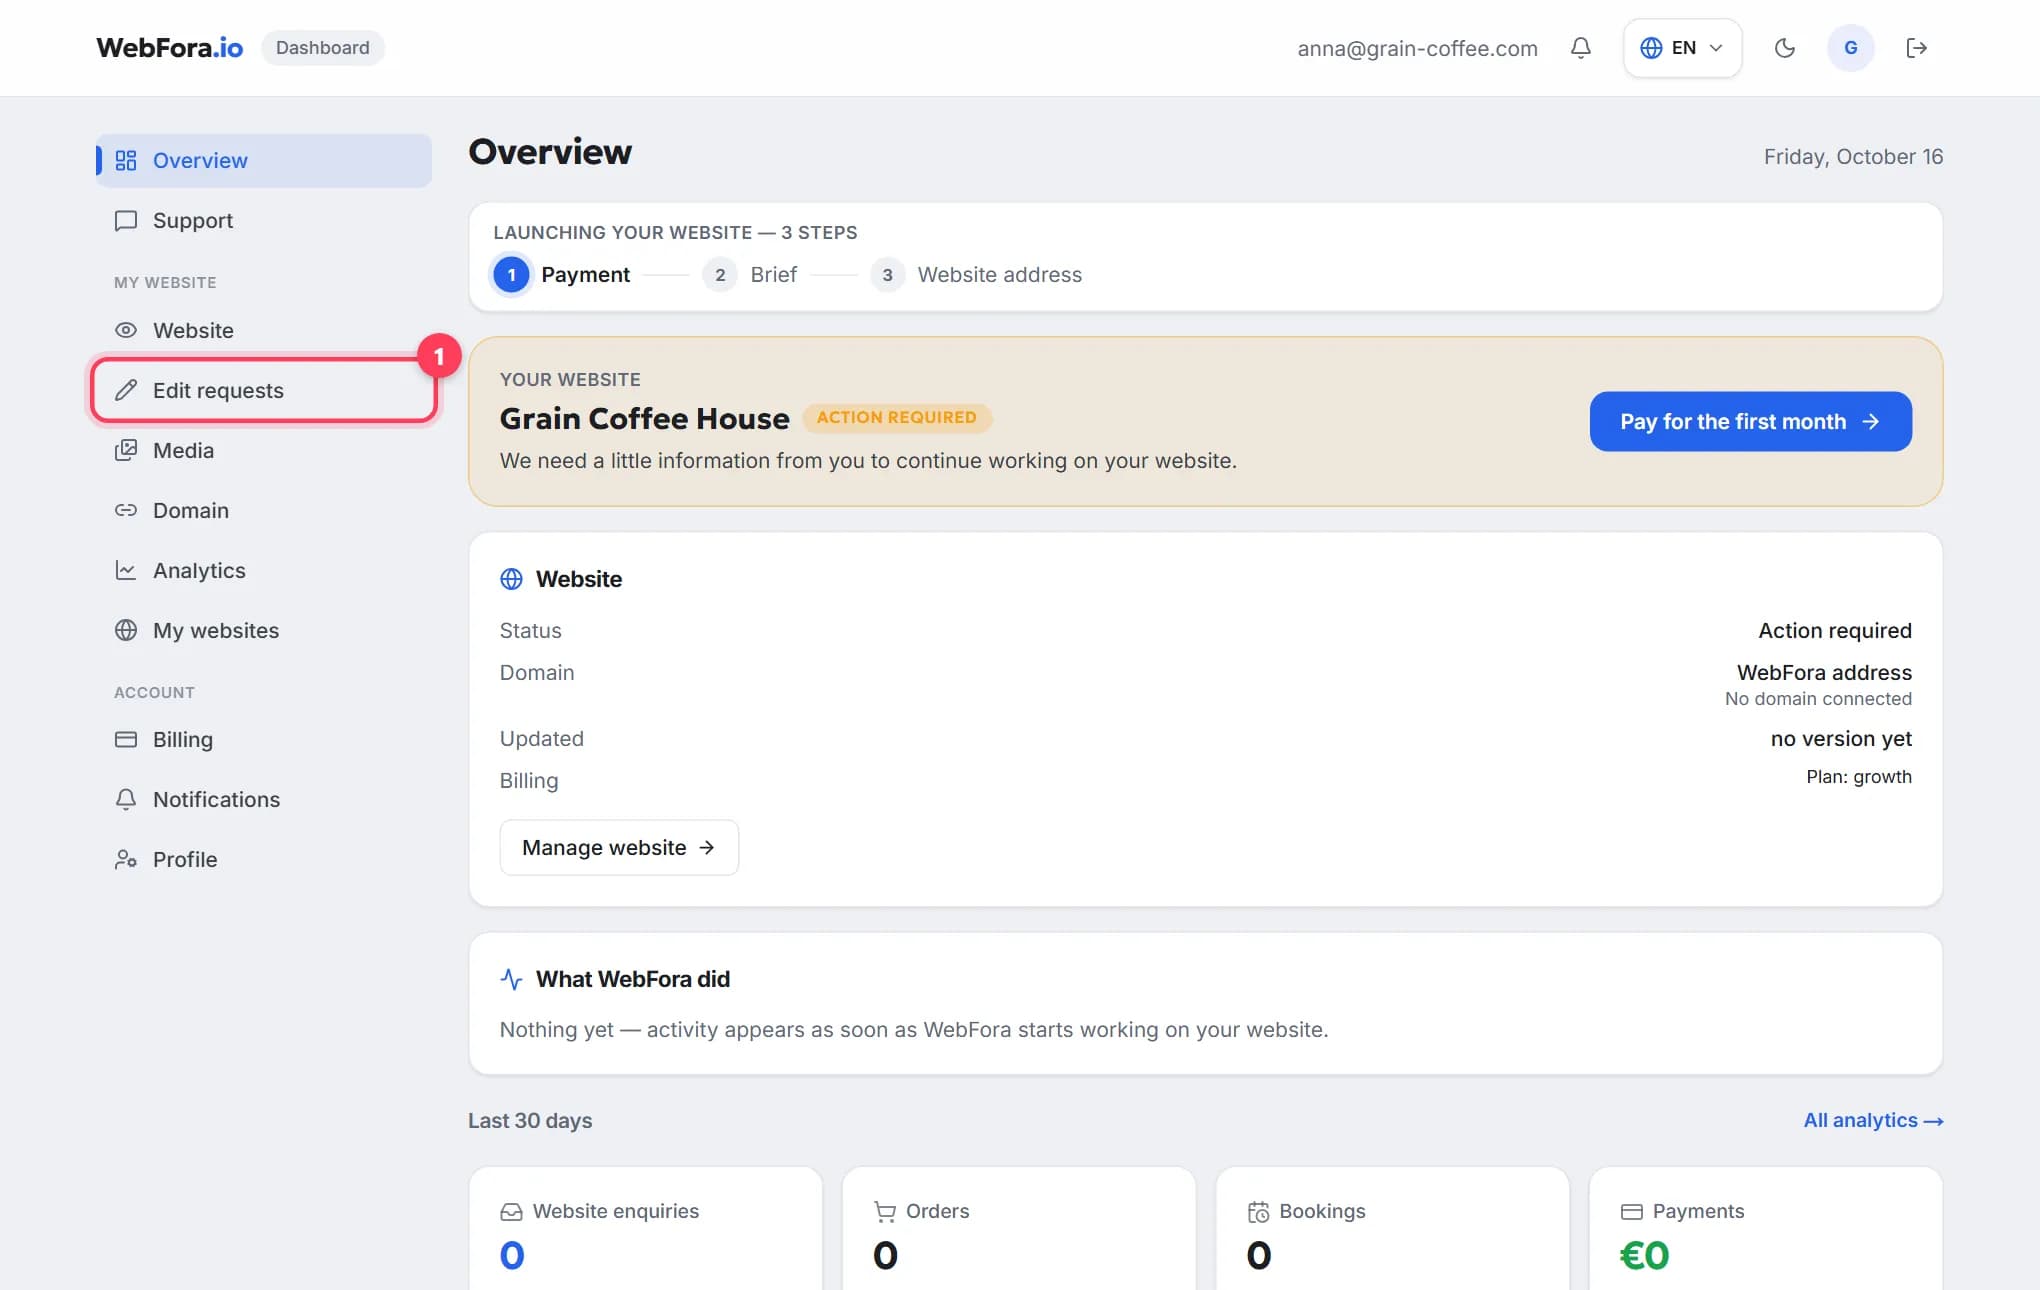
The WebFora client dashboard: what is where
A tour of the WebFora client dashboard: each menu item, the website status block, what the team did, 30-day enquiries and where to message your manager.
6 min readHow to request changes to your website
Get text, photos, prices or opening hours changed on your website: send an edit request, see your free edits left, get quotes for custom work, track it.
5 min read